\n
## Diagram: Falsification Iteration Process
### Overview
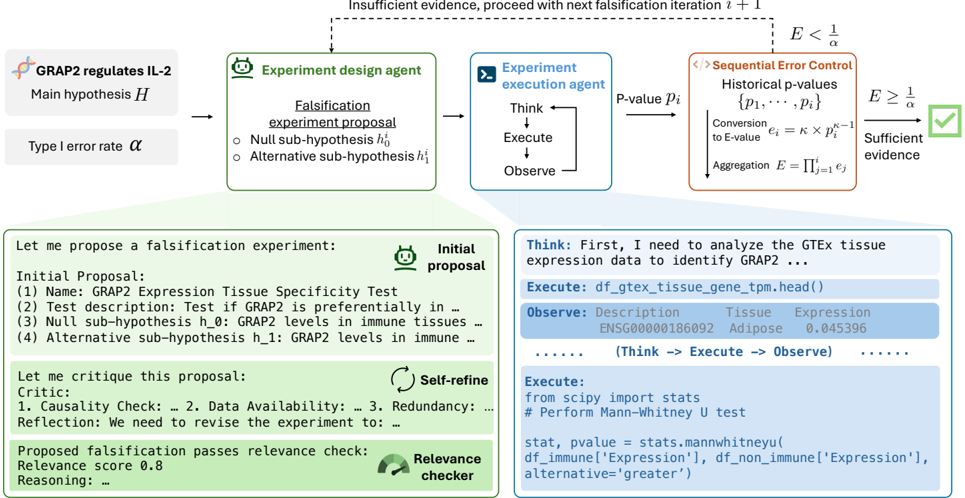
This diagram illustrates an iterative process of scientific falsification, specifically focusing on testing the hypothesis that "GRAP2 regulates IL-2". The process involves an experiment design agent, an experiment execution agent, and a relevance checker, cycling through proposal, execution, observation, and critique stages. The diagram also incorporates concepts of statistical error control and evidence aggregation.
### Components/Axes
The diagram is segmented into several key areas:
* **Top-Left (Hypothesis & Error):** Defines the main hypothesis (H), type I error rate (α), and sub-hypotheses (H₀, H₁).
* **Top-Center (Experiment Design Agent):** A circular process labeled "Experiment design agent" with steps: Falsification experiment proposal, Null sub-hypothesis (H₀), Alternative sub-hypothesis (H₁).
* **Top-Right (Sequential Error Control):** A section detailing sequential error control, historical p-values (P₁, ..., Pᵢ), conversion to E-value, and aggregation (E = Πᵢ₌₁ᵉ Eᵢ). Includes the conditions for insufficient and sufficient evidence (E ≤ 1/α and E ≥ 1/α respectively).
* **Bottom-Left (Initial Proposal):** Outlines an initial falsification proposal with numbered steps: Name, Test description, Null sub-hypothesis, Alternative sub-hypothesis.
* **Bottom-Center (Think-Execute-Observe):** A loop representing the experiment execution process, with "Think", "Execute", and "Observe" stages. Includes example code and output.
* **Bottom-Right (Self-Refine & Relevance Checker):** Details a critique process with causality check, data availability, redundancy, and reflection. Includes a relevance score (0.8) and reasoning.
### Detailed Analysis or Content Details
**Top-Left:**
* **GRAP2 regulates IL-2:** Main hypothesis (H).
* **Type I error rate α:** Indicates the probability of a false positive.
**Top-Center:**
* The process flows from "Falsification experiment proposal" to "Null sub-hypothesis (H₀)" and "Alternative sub-hypothesis (H₁)", then back to the beginning.
**Top-Right:**
* **Historical p-values (P₁, ..., Pᵢ):** A sequence of p-values.
* **Conversion eᵢ = K * pᵢ⁻¹ to E-value:** A formula for converting p-values to E-values.
* **Aggregation E = Πᵢ₌₁ᵉ Eᵢ:** A formula for aggregating E-values.
* **E ≤ 1/α:** Condition for insufficient evidence.
* **E ≥ 1/α:** Condition for sufficient evidence.
**Bottom-Left (Initial Proposal):**
1. **Name:** GRAP2 Expression Tissue Specificity Test
2. **Test description:** Test if GRAP2 is preferentially expressed in …
3. **Null sub-hypothesis h₀:** GRAP2 levels in immune tissues …
4. **Alternative sub-hypothesis h₁:** GRAP2 levels in immune …
**Bottom-Center (Think-Execute-Observe):**
* **Think:** First, I need to analyze the GTEx tissue expression data to identify GRAP2 …
* **Execute:** `df_gtex_tissue_gene_tpm.head()`
* **Observe:**
* **ENSG00000186092:** Adipose 0.045396
**Bottom-Right (Self-Refine & Relevance Checker):**
* **Causality Check:** …
* **Data Availability:** …
* **Redundancy:** …
* **Reflection:** We need to revise the experiment to …
* **Relevance score 0.8**
* **Reasoning:** …
* **Execute:**
```python
from scipy import stats
# Perform Mann-Whitney U test
stat, pvalue = stats.mannwhitneyu(
df_immune['Expression'], df_non_immune['Expression'],
alternative='greater'
)
```
### Key Observations
* The diagram emphasizes an iterative process of falsification, rather than confirmation.
* Statistical rigor is integrated through the error control and evidence aggregation sections.
* The "Think-Execute-Observe" loop highlights the cyclical nature of experimentation.
* The relevance checker provides a mechanism for evaluating the quality and direction of the experiment.
* The initial proposal is a specific test for tissue-specific expression of GRAP2.
* The code snippet suggests a Mann-Whitney U test is being used to compare expression levels between immune and non-immune tissues.
### Interpretation
This diagram represents a sophisticated approach to scientific inquiry, grounded in the principles of falsification and statistical analysis. The iterative nature of the process allows for continuous refinement of hypotheses and experimental designs. The inclusion of error control and evidence aggregation ensures that conclusions are drawn with appropriate statistical confidence. The relevance checker adds a layer of quality control, preventing the pursuit of unproductive lines of inquiry.
The diagram suggests a workflow where a researcher starts with a broad hypothesis (GRAP2 regulates IL-2), formulates specific, falsifiable sub-hypotheses, designs experiments to test those sub-hypotheses, analyzes the results, and then revises the hypothesis or experimental design based on the evidence. The use of the Mann-Whitney U test indicates a focus on comparing expression levels between different tissue types, potentially to identify tissue-specific roles for GRAP2. The relevance score of 0.8 suggests that the initial proposal is considered reasonably relevant, but further refinement may be necessary.
The diagram is a visual representation of a rigorous scientific methodology, emphasizing the importance of critical thinking, statistical analysis, and iterative refinement in the pursuit of knowledge. It's a blueprint for how to approach a biological question in a systematic and evidence-based manner.