TECHNICAL ASSET FINGERPRINT
48f2620770c425d44fdd8dfe
Click to view fullscreen
Press ESC or click to close
FOUND IN PAPERS
EXPERT: healer-alpha-free VERSION 1
RUNTIME: free/openrouter/healer-alpha
INTEL_VERIFIED
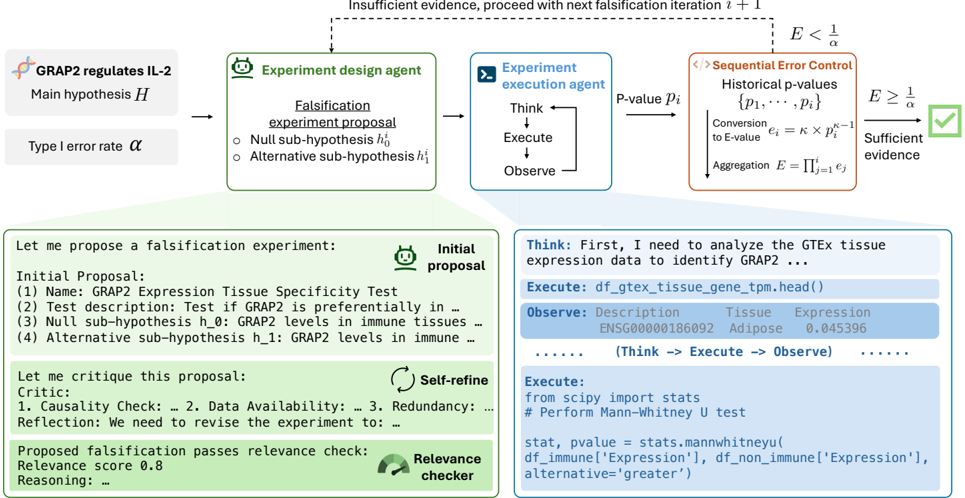
## Diagram: Automated Scientific Hypothesis Falsification Workflow
### Overview
The image depicts a technical flowchart and detailed panels illustrating an automated, agent-based system for scientific hypothesis testing. The system uses a falsification approach, where experiments are designed to challenge a main hypothesis, executed by agents, and evaluated using sequential error control with E-values. The diagram includes both a high-level process flow and concrete examples of proposal generation, refinement, and code execution.
### Components/Axes
The diagram is segmented into three primary regions:
1. **Top Flowchart (Process Overview):**
* **Input (Left):** Main hypothesis `H`: "GRAP2 regulates IL-2". Type I error rate `α`.
* **Agent 1 (Green Box):** "Experiment design agent". Outputs a "Falsification experiment proposal" containing a "Null sub-hypothesis h₀" and an "Alternative sub-hypothesis h₁".
* **Agent 2 (Blue Box):** "Experiment execution agent". Follows a "Think → Execute → Observe" loop. Outputs a "P-value pᵢ".
* **Control Module (Orange Box):** "Sequential Error Control". Contains:
* "Historical p-values {p₁, ..., pᵢ}"
* "Conversion to E-value: eᵢ = κ × pᵢ^(κ-1)"
* "Aggregation: E = Πⱼ₌₁ⁱ eⱼ"
* **Decision Node:** Compares aggregated E-value `E` to `1/α`.
* If `E < 1/α`: "Insufficient evidence, proceed with next falsification iteration i + 1" (dashed arrow loops back to the design agent).
* If `E ≥ 1/α`: "Sufficient evidence" (leads to a green checkmark).
2. **Left Panel (Proposal & Refinement):**
* **Header:** "Let me propose a falsification experiment:" with an "Initial proposal" icon.
* **Initial Proposal Content:**
* (1) Name: GRAP2 Expression Tissue Specificity Test
* (2) Test description: Test if GRAP2 is preferentially in ...
* (3) Null sub-hypothesis h_0: GRAP2 levels in immune tissues ...
* (4) Alternative sub-hypothesis h_1: GRAP2 levels in immune ...
* **Self-Refine Section:** "Let me critique this proposal:" with a "Self-refine" icon.
* Critic: 1. Causality Check: ... 2. Data Availability: ... 3. Redundancy: ...
* Reflection: We need to revise the experiment to: ...
* **Relevance Check:** "Proposed falsification passes relevance check:" with a "Relevance checker" icon.
* Relevance score: 0.8
* Reasoning: ...
3. **Right Panel (Execution Example):**
* **Header:** "Think: First, I need to analyze the GTEx tissue expression data to identify GRAP2 ..."
* **Code Block 1 (Execute):** `df_gtex_tissue_gene_tpm.head()`
* **Output Table (Observe):**
* Columns: `Description`, `Tissue`, `Expression`
* First Row: `ENSG00000186092`, `Adipose`, `0.045396`
* Followed by "......" indicating more data.
* **Loop Indicator:** "(Think → Execute → Observe) ......"
* **Code Block 2 (Execute):**
```python
from scipy import stats
# Perform Mann-Whitney U test
stat, pvalue = stats.mannwhitneyu(
df_immune['Expression'],
df_non_immune['Expression'],
alternative='greater'
)
```
### Detailed Analysis
The workflow operates as a closed-loop, iterative system:
1. **Hypothesis Falsification:** The core logic is not to prove `H` true, but to design experiments (`h₀`, `h₁`) that could falsify it.
2. **Sequential Testing:** P-values from each experiment iteration (`pᵢ`) are not used in a traditional single-test manner. They are converted to **E-values** (`eᵢ`) using a parameter `κ` (kappa), then multiplicatively aggregated (`E = Π eⱼ`). This allows for continuous evidence accumulation.
3. **Decision Rule:** The aggregated evidence `E` is compared to a threshold `1/α`. The loop continues (`E < 1/α`) until the evidence against the null is strong enough (`E ≥ 1/α`), at which point the process concludes with "Sufficient evidence."
4. **Agent Specialization:** The "Design Agent" focuses on proposing and refining testable sub-hypotheses, incorporating checks for causality, data availability, and relevance (score 0.8). The "Execution Agent" handles the computational work, demonstrated by querying a GTEx dataset and running a Mann-Whitney U test (a non-parametric test for comparing distributions, here used with `alternative='greater'`).
### Key Observations
* **Mathematical Formalism:** The diagram explicitly defines the conversion from p-value to E-value (`eᵢ = κ × pᵢ^(κ-1)`) and the aggregation method (product, `Π`). This is a specific implementation of E-value-based sequential testing.
* **Concrete Example:** The right panel grounds the abstract flowchart in a real-world bioinformatics task: testing if the gene GRAP2 shows higher expression in immune tissues versus non-immune tissues using GTEx data.
* **Iterative Refinement:** The left panel shows the proposal isn't static; it undergoes a "Self-refine" critique loop before being checked for relevance.
* **Spatial Layout:** The main process flows left-to-right at the top. The detailed examples are placed directly below their corresponding agent boxes (Design Agent → Left Panel, Execution Agent → Right Panel), creating a clear visual association.
### Interpretation
This diagram represents a sophisticated framework for **automated scientific discovery**. It moves beyond simple A/B testing by integrating:
1. **Philosophy of Science:** It operationalizes Karl Popper's principle of falsification, where science progresses by disproving hypotheses.
2. **Modern Statistics:** It employs E-values, a contemporary alternative to p-values, which are better suited for sequential analysis and provide a direct measure of evidence strength.
3. **AI Agent Architecture:** It decomposes the scientific process into specialized, interacting agents (designer, executor, critic, checker), mimicking a collaborative research team.
4. **Reproducibility & Transparency:** The inclusion of specific code snippets (Python, pandas, scipy) and data sources (GTEx) emphasizes a reproducible computational workflow.
The system's goal is to autonomously navigate the space of possible experiments, efficiently accumulating statistical evidence to either falsify a main hypothesis or, through repeated failure to falsify, build a case for its plausibility. The "Relevance score" suggests an additional layer of meta-evaluation to ensure experiments are meaningful. This is a blueprint for an AI-driven research assistant capable of conducting and evaluating complex, multi-step investigations.
DECODING INTELLIGENCE...