## Diagram Type: Flowchart
### Overview
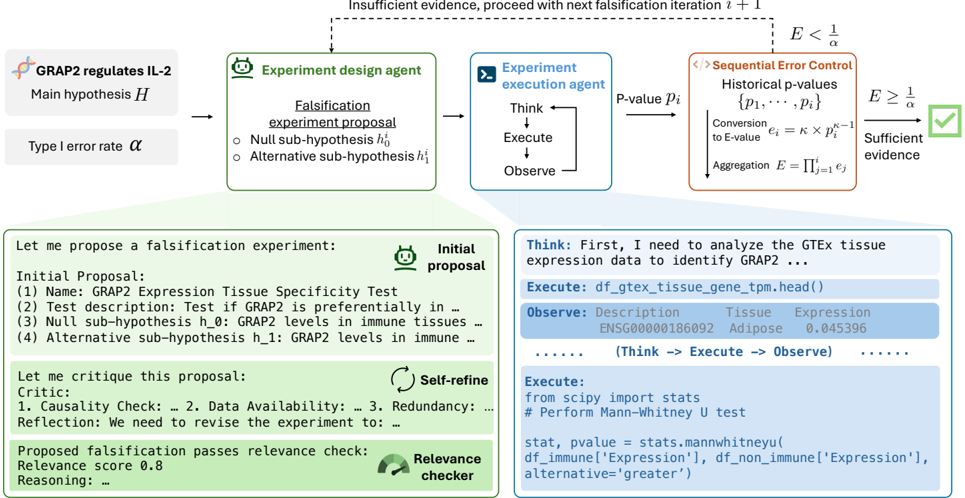
The image is a flowchart that illustrates the process of designing and executing an experiment to test the hypothesis that GRAP2 regulates IL-2. The flowchart is divided into several stages, each represented by a box with a label and arrows indicating the flow of the process.
### Components/Axes
- **Main Hypothesis (H)**: The central hypothesis that GRAP2 regulates IL-2.
- **Type I Error Rate (α)**: The significance level of the experiment.
- **Experiment Design Agent**: The entity responsible for designing the experiment.
- **Experiment Execution Agent**: The entity responsible for executing the experiment.
- **Falsification Experiment Proposal**: The initial proposal for the experiment.
- **Null Sub-hypothesis (h₀)**: The hypothesis that GRAP2 levels are the same in immune tissues.
- **Alternative Sub-hypothesis (h₁)**: The hypothesis that GRAP2 levels are different in immune tissues.
- **Sequential Error Control**: A process for controlling the error rate in the experiment.
- **Historical p-values**: The p-values from previous experiments.
- **P-value (Pᵢ)**: The p-value for the current experiment.
- **E-value (eᵢ)**: The E-value for the current experiment.
- **Aggregation (E)**: The aggregated E-value from all experiments.
- **Relevance Checker**: A tool for checking the relevance of the experiment.
- **Self-refine**: A process for refining the experiment based on feedback.
### Detailed Analysis or ### Content Details
- **Initial Proposal**: The initial proposal for the experiment is to test if GRAP2 is preferentially expressed in immune tissues.
- **Null Sub-hypothesis**: The null sub-hypothesis is that GRAP2 levels are the same in immune tissues.
- **Alternative Sub-hypothesis**: The alternative sub-hypothesis is that GRAP2 levels are different in immune tissues.
- **Sequential Error Control**: The sequential error control process involves calculating the p-value for the current experiment and comparing it to the historical p-values. If the p-value is less than the significance level (α), the experiment is considered significant, and the null hypothesis is rejected. If the p-value is greater than or equal to α, the experiment is considered insignificant, and the null hypothesis is not rejected.
- **Historical p-values**: The historical p-values are used to set the significance level (α) for the current experiment.
- **P-value (Pᵢ)**: The p-value for the current experiment is calculated using a statistical test, such as the Mann-Whitney U test.
- **E-value (eᵢ)**: The E-value for the current experiment is calculated as the inverse of the p-value.
- **Aggregation (E)**: The aggregated E-value from all experiments is used to determine the overall significance of the experiment.
- **Relevance Checker**: The relevance checker is used to determine whether the experiment is relevant to the main hypothesis.
- **Self-refine**: The self-refine process involves refining the experiment based on feedback from the relevance checker.
### Key Observations
- The experiment is designed to test the hypothesis that GRAP2 regulates IL-2.
- The null sub-hypothesis is that GRAP2 levels are the same in immune tissues.
- The alternative sub-hypothesis is that GRAP2 levels are different in immune tissues.
- The sequential error control process is used to control the error rate in the experiment.
- The historical p-values are used to set the significance level (α) for the current experiment.
- The p-value (Pᵢ) and E-value (eᵢ) are calculated using a statistical test, such as the Mann-Whitney U test.
- The aggregated E-value from all experiments is used to determine the overall significance of the experiment.
- The relevance checker is used to determine whether the experiment is relevant to the main hypothesis.
- The self-refine process involves refining the experiment based on feedback from the relevance checker.
### Interpretation
The data suggests that the experiment is designed to test the hypothesis that GRAP2 regulates IL-2. The null sub-hypothesis is that GRAP2 levels are the same in immune tissues, and the alternative sub-hypothesis is that GRAP2 levels are different in immune tissues. The sequential error control process is used to control the error rate in the experiment, and the historical p-values are used to set the significance level (α) for the current experiment. The p-value (Pᵢ) and E-value (eᵢ) are calculated using a statistical test, such as the Mann-Whitney U test, and the aggregated E-value from all experiments is used to determine the overall significance of the experiment. The relevance checker is used to determine whether the experiment is relevant to the main hypothesis, and the self-refine process involves refining the experiment based on feedback from the relevance checker. The data suggests that the experiment is designed to test the hypothesis that GRAP2 regulates IL-2, and the results of the experiment will be used to determine whether the null hypothesis is rejected or not.