## Flowchart: Experimental Falsification Process for GRAP2-IL-2 Regulation Hypothesis
### Overview
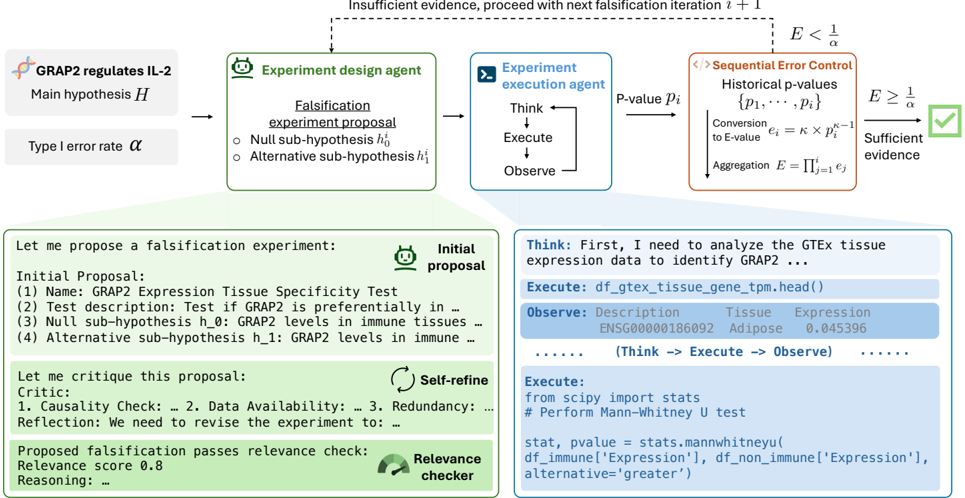
This diagram illustrates a systematic workflow for designing, executing, and evaluating falsification experiments to test the hypothesis "GRAP2 regulates IL-2." The process integrates statistical rigor, iterative refinement, and automated execution, with decision points based on evidence sufficiency thresholds.
---
### Components/Axes
1. **Main Hypothesis (H)**: "GRAP2 regulates IL-2" (top-left)
2. **Type I Error Rate (α)**: Threshold for statistical significance
3. **Experiment Design Agent**: Generates falsification proposals
4. **Experiment Execution Agent**: Executes tests and observes outcomes
5. **Historical Error Control**: Aggregates p-values into E-values for error rate adjustment
6. **Text Boxes**: Contain code snippets (Python/R) and hypothesis descriptions
---
### Detailed Analysis
#### Experiment Design Agent
- **Input**: Main hypothesis H, α
- **Output**: Falsification proposal with:
- Test description (e.g., "Test if GRAP2 is preferentially in...")
- Null sub-hypothesis (h₀: GRAP2 levels in immune tissues...)
- Alternative sub-hypothesis (h₁: GRAP2 levels in immune...)
#### Experiment Execution Agent
- **Workflow**: Think → Execute → Observe
- **Execution**: Runs code (e.g., `df_gtex_tissue_gene_tpm.head()`)
- **Output**: p-value (pᵢ) from statistical tests (e.g., Mann-Whitney U)
#### Historical Error Control
- **Process**:
1. Converts p-values to E-values: eᵢ = κpᵢ⁻¹
2. Aggregates E-values: E = Πᵢᵉᵢ
3. Compares E to α threshold:
- E ≥ 1/α → Sufficient evidence (green check)
- E < 1/α → Insufficient evidence (red cross)
#### Text Boxes
- **Left Panel**: Proposed experiment details (e.g., "GRAP2 Expression Tissue Specificity Test")
- **Right Panel**: Code execution steps: