## Chart: Cumulative Density Function of Relative Absolute Error
### Overview
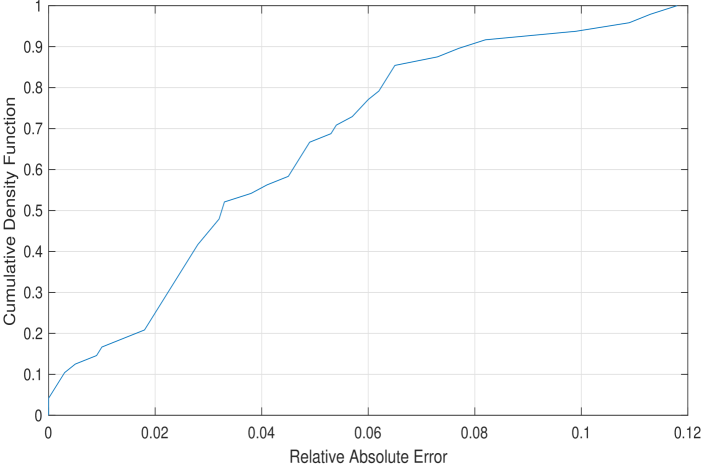
The image is a plot of the cumulative density function (CDF) of the relative absolute error. The x-axis represents the relative absolute error, and the y-axis represents the cumulative density function. The plot shows how the cumulative probability of the relative absolute error increases as the error increases.
### Components/Axes
* **X-axis:** Relative Absolute Error, ranging from 0 to 0.12 with increments of 0.02.
* **Y-axis:** Cumulative Density Function, ranging from 0 to 1 with increments of 0.1.
* **Data Series:** A single blue line representing the cumulative density function.
### Detailed Analysis
The blue line represents the cumulative density function. The line starts at approximately (0, 0.04) and increases monotonically.
Here are some approximate data points:
* (0, 0.04)
* (0.01, 0.16)
* (0.02, 0.21)
* (0.03, 0.52)
* (0.04, 0.55)
* (0.05, 0.68)
* (0.06, 0.78)
* (0.07, 0.86)
* (0.08, 0.91)
* (0.09, 0.92)
* (0.10, 0.94)
* (0.11, 0.95)
* (0.12, 0.97)
The CDF increases rapidly initially, then the rate of increase slows down as the relative absolute error increases.
### Key Observations
* The CDF starts at a non-zero value (approximately 0.04) at a relative absolute error of 0.
* The CDF approaches 1 as the relative absolute error increases, indicating that almost all data points have a relative absolute error less than 0.12.
* The curve is steeper for smaller values of relative absolute error, indicating that a larger proportion of data points have smaller errors.
### Interpretation
The plot shows the distribution of relative absolute errors. The CDF indicates the probability that the relative absolute error is less than or equal to a given value. The shape of the CDF suggests that the errors are concentrated at lower values, with a long tail extending to higher values. This indicates that the model or method used to generate the data has a tendency to produce small errors, with occasional larger errors. The fact that the CDF reaches nearly 1 at a relative absolute error of 0.12 suggests that the model is reasonably accurate, with most errors being relatively small.