## Line Graph: Surprisal vs. Training Steps
### Overview
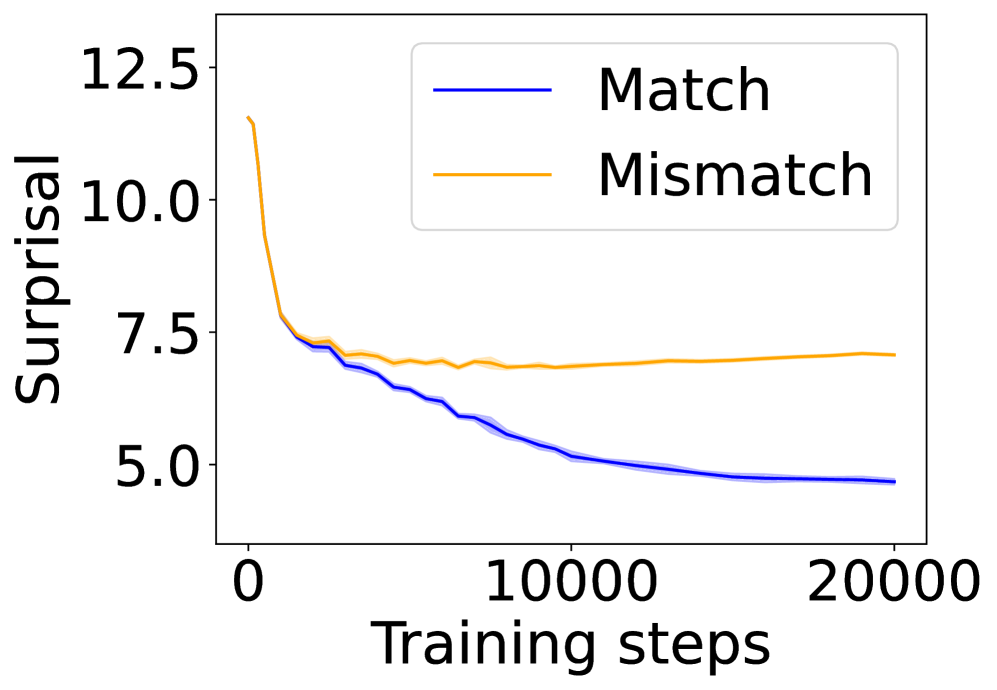
The image depicts a line graph comparing the "Surprisal" metric across two conditions ("Match" and "Mismatch") over 20,000 training steps. Both lines show a general decline in surprisal, but with distinct trends in their trajectories.
### Components/Axes
- **X-axis**: "Training steps" (0 to 20,000, labeled in increments of 10,000).
- **Y-axis**: "Surprisal" (5.0 to 12.5, labeled in increments of 2.5).
- **Legend**: Located in the top-right corner, with:
- **Blue line**: "Match"
- **Orange line**: "Mismatch"
### Detailed Analysis
1. **Match (Blue Line)**:
- Starts at approximately **12.5** surprisal at 0 training steps.
- Drops sharply to ~**7.5** by 10,000 steps.
- Stabilizes near **5.0** by 20,000 steps.
- Shows a steep initial decline followed by a plateau.
2. **Mismatch (Orange Line)**:
- Begins slightly lower than "Match" at ~**12.0** surprisal at 0 steps.
- Declines gradually to ~**7.0** by 10,000 steps.
- Remains relatively flat at ~**7.0** by 20,000 steps.
- Exhibits a slower, more gradual decline compared to "Match".
### Key Observations
- Both conditions show a **decreasing trend** in surprisal over training steps.
- "Match" demonstrates a **steeper initial decline** (12.5 → 5.0) compared to "Mismatch" (12.0 → 7.0).
- After ~10,000 steps, "Match" plateaus at a lower surprisal value than "Mismatch".
- The orange line ("Mismatch") exhibits **greater variability** in its early trajectory (e.g., minor fluctuations between 7.5 and 8.0).
### Interpretation
The graph suggests that the "Match" condition adapts more efficiently to the training process, achieving lower surprisal values earlier and maintaining stability. The "Mismatch" condition, while also improving, retains higher surprisal values, potentially indicating:
- **Slower learning dynamics** or **greater complexity** in the mismatch scenario.
- **Persistent uncertainty** in the mismatch case, even after extensive training.
- The divergence between the two lines highlights the impact of condition-specific factors (e.g., data alignment, task difficulty) on model performance. The plateau in both lines implies diminishing returns in surprisal reduction beyond ~10,000 steps.