\n
## Line Chart: Surprisal vs. Training Steps
### Overview
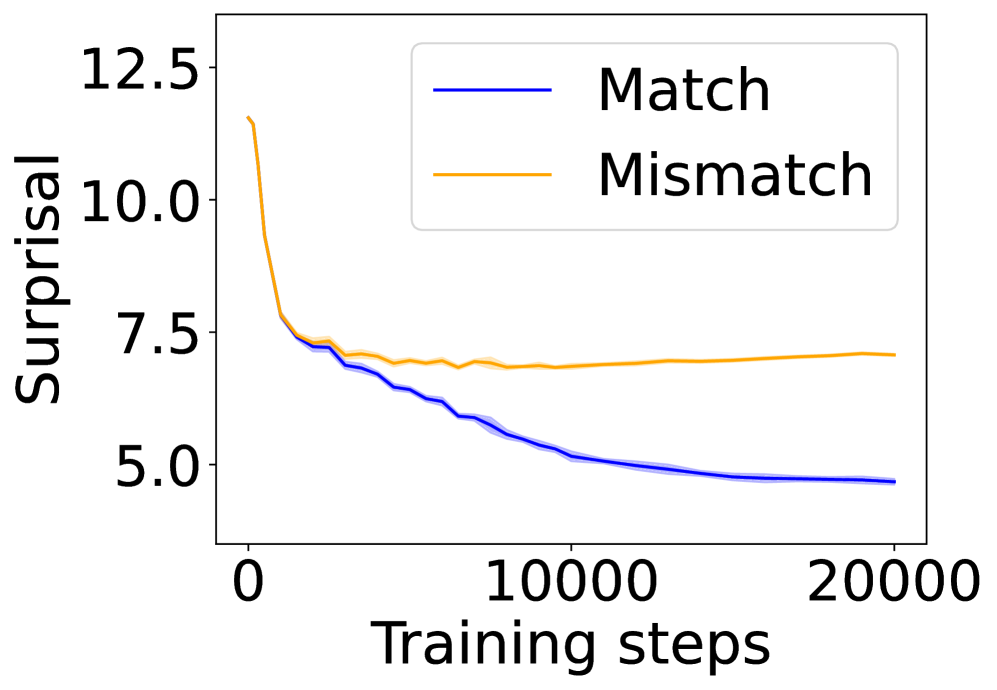
The image presents a line chart illustrating the relationship between "Surprisal" (y-axis) and "Training steps" (x-axis). Two data series are plotted: one representing "Match" and the other "Mismatch" conditions. Both series show a decreasing trend in surprisal as training steps increase, suggesting a learning or adaptation process.
### Components/Axes
* **X-axis:** "Training steps", ranging from approximately 0 to 20000. The axis is linearly scaled.
* **Y-axis:** "Surprisal", ranging from approximately 5 to 12.5. The axis is linearly scaled.
* **Legend:** Located in the top-right corner of the chart.
* "Match" - represented by a dark blue line.
* "Mismatch" - represented by a orange line.
### Detailed Analysis
**Match (Dark Blue Line):**
The "Match" line starts at approximately 7.2 surprisal at 0 training steps. It exhibits a generally downward trend, with some fluctuations.
* At 0 training steps: ~7.2 surprisal
* At 5000 training steps: ~6.0 surprisal
* At 10000 training steps: ~5.5 surprisal
* At 15000 training steps: ~5.2 surprisal
* At 20000 training steps: ~5.0 surprisal
**Mismatch (Orange Line):**
The "Mismatch" line begins at approximately 11.0 surprisal at 0 training steps. It also shows a decreasing trend, but it plateaus at a higher surprisal level than the "Match" line.
* At 0 training steps: ~11.0 surprisal
* At 5000 training steps: ~7.5 surprisal
* At 10000 training steps: ~7.0 surprisal
* At 15000 training steps: ~6.8 surprisal
* At 20000 training steps: ~6.6 surprisal
### Key Observations
* Both "Match" and "Mismatch" surprisal values decrease with increasing training steps, indicating that the model is learning to better predict or represent the data in both conditions.
* The "Mismatch" condition consistently exhibits higher surprisal values than the "Match" condition across all training steps. This suggests that the model finds the "Mismatch" condition more unexpected or difficult to predict.
* The rate of decrease in surprisal appears to slow down as training progresses for both conditions, indicating diminishing returns from further training.
### Interpretation
This chart likely represents the training process of a model designed to distinguish between "Match" and "Mismatch" conditions. "Surprisal" can be interpreted as a measure of how unexpected or unlikely the model finds a particular input. The decreasing surprisal values suggest that the model is becoming more confident in its predictions as it is exposed to more training data.
The consistently higher surprisal for the "Mismatch" condition indicates that the model struggles more with this type of input. This could be due to several factors, such as the "Mismatch" condition being inherently more complex, the training data being biased towards the "Match" condition, or the model architecture being less suited to handle "Mismatch" inputs.
The plateauing of the surprisal curves suggests that the model is approaching its maximum performance level and that further training may not yield significant improvements. This could be a signal to stop training and evaluate the model's performance on a held-out test set.