## Chart: Proportion of Flips vs. Iterations for Qwen2.5-3B
### Overview
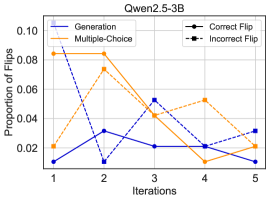
The image is a line chart comparing the proportion of flips (presumably in a model's output) across iterations for two different methods: Generation and Multiple-Choice. It also distinguishes between correct and incorrect flips. The chart displays how the proportion of flips changes over five iterations for each method and flip type.
### Components/Axes
* **Title:** Qwen2.5-3B
* **X-axis:** Iterations (labeled 1 to 5)
* **Y-axis:** Proportion of Flips (labeled from 0.02 to 0.10, incrementing by 0.02)
* **Legend (top-left):**
* **Generation:** Solid blue line
* **Multiple-Choice:** Solid orange line
* **Correct Flip:** Solid black line with circle markers
* **Incorrect Flip:** Dashed black line with square markers
### Detailed Analysis
* **Generation (Solid Blue Line):**
* Trend: Fluctuates significantly.
* Iteration 1: ~0.01
* Iteration 2: ~0.03
* Iteration 3: ~0.05
* Iteration 4: ~0.02
* Iteration 5: ~0.01
* **Multiple-Choice (Solid Orange Line):**
* Trend: Starts high, drops, then rises again.
* Iteration 1: ~0.085
* Iteration 2: ~0.085
* Iteration 3: ~0.04
* Iteration 4: ~0.01
* Iteration 5: ~0.02
* **Correct Flip (Dashed Black Line with Square Markers):**
* Trend: Starts low, rises, then fluctuates.
* Iteration 1: ~0.02
* Iteration 2: ~0.07
* Iteration 3: ~0.04
* Iteration 4: ~0.05
* Iteration 5: ~0.03
* **Incorrect Flip (Solid Black Line with Circle Markers):**
* Trend: Starts high, drops, then fluctuates.
* Iteration 1: ~0.085
* Iteration 2: ~0.01
* Iteration 3: ~0.02
* Iteration 4: ~0.02
* Iteration 5: ~0.03
### Key Observations
* The "Generation" method has a lower proportion of flips compared to the "Multiple-Choice" method in the first iteration, but the "Multiple-Choice" method decreases significantly over the iterations.
* The proportion of "Correct Flips" increases initially, while the proportion of "Incorrect Flips" decreases.
* Both "Generation" and "Multiple-Choice" methods converge to a similar proportion of flips by the 5th iteration.
### Interpretation
The chart illustrates the performance of the Qwen2.5-3B model under different conditions (Generation vs. Multiple-Choice) and how the proportion of flips changes over iterations. The initial high proportion of flips in the "Multiple-Choice" method suggests that the model might be more prone to making changes in its initial responses when presented with multiple options. However, the decrease in flips over iterations indicates that the model learns to stabilize its responses. The "Generation" method, starting with a lower proportion of flips, might indicate a more stable initial response. The convergence of both methods towards the end suggests that the model adapts and improves its consistency over time, regardless of the initial method. The distinction between "Correct" and "Incorrect" flips provides insight into the quality of these changes, showing how the model's ability to make correct adjustments evolves over iterations.