\n
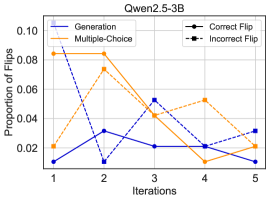
## Line Chart: Proportion of Flips vs. Iterations (Qwen2.5-3B)
### Overview
This line chart displays the proportion of flips across different iterations for various methods: Generation, Multiple-Choice, Correct Flip, and Incorrect Flip. The chart appears to be evaluating the performance of a model (Qwen2.5-3B) over several iterations, likely in a training or evaluation context.
### Components/Axes
* **Title:** Qwen2.5-3B (positioned top-center)
* **X-axis:** Iterations (labeled, ranging from 1 to 5, with tick marks at each integer value)
* **Y-axis:** Proportion of Flips (labeled, ranging from 0.00 to 0.10, with tick marks at 0.02 intervals)
* **Legend:** Located at the top-right of the chart.
* Generation (Blue solid line)
* Multiple-Choice (Orange solid line)
* Correct Flip (Black dashed line)
* Incorrect Flip (Black dotted line)
### Detailed Analysis
The chart contains four distinct lines representing the proportion of flips for each method across the five iterations.
* **Generation (Blue):** The line starts at approximately 0.01 at iteration 1, increases to around 0.03 at iteration 2, decreases to approximately 0.02 at iteration 3, dips to around 0.02 at iteration 4, and then rises slightly to approximately 0.025 at iteration 5. The trend is generally flat with minor fluctuations.
* **Multiple-Choice (Orange):** This line begins at approximately 0.02 at iteration 1, rises sharply to around 0.08 at iteration 2, decreases to approximately 0.04 at iteration 3, increases to around 0.055 at iteration 4, and then declines to approximately 0.03 at iteration 5. This line exhibits a more pronounced peak at iteration 2.
* **Correct Flip (Black dashed):** The line starts at approximately 0.08 at iteration 1, decreases to around 0.055 at iteration 3, increases to approximately 0.06 at iteration 4, and then declines to approximately 0.05 at iteration 5. This line shows a general decreasing trend with some fluctuations.
* **Incorrect Flip (Black dotted):** This line begins at approximately 0.08 at iteration 1, decreases to around 0.02 at iteration 5. This line shows a consistent decreasing trend.
### Key Observations
* The "Multiple-Choice" method shows the most significant variation in the proportion of flips, peaking at iteration 2.
* Both "Correct Flip" and "Incorrect Flip" start at the same proportion (approximately 0.08) but diverge over the iterations, with "Incorrect Flip" decreasing more rapidly.
* The "Generation" method exhibits the most stable behavior, with relatively small changes in the proportion of flips across iterations.
* The "Incorrect Flip" proportion is consistently lower than the "Correct Flip" proportion, suggesting a bias towards correct flips.
### Interpretation
The data suggests that the Qwen2.5-3B model's behavior changes over iterations, as reflected in the varying proportions of flips for each method. The peak in "Multiple-Choice" flips at iteration 2 could indicate a period of increased exploration or uncertainty in the model's responses. The decreasing trend in "Incorrect Flip" suggests that the model is learning to avoid incorrect responses over time. The relatively stable "Generation" line might indicate that the model's generative capabilities are less sensitive to the iterative process. The consistent difference between "Correct Flip" and "Incorrect Flip" suggests a learning process where the model is increasingly favoring correct responses. The chart provides insights into the model's learning dynamics and the effectiveness of different methods in guiding its behavior. The fact that the "Incorrect Flip" proportion decreases over time is a positive sign, indicating that the model is improving its accuracy.