## Scatter Plot with Heatmaps and Map: Energy vs. I0 with City Visit Order
### Overview
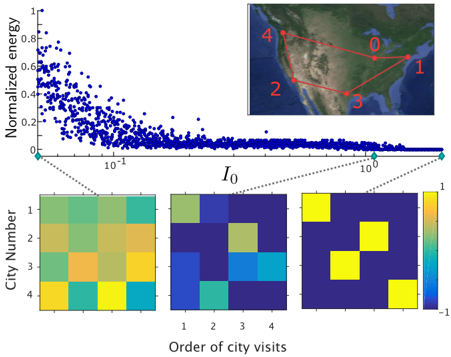
The image presents a scatter plot showing the relationship between normalized energy and a parameter I0, accompanied by three heatmaps visualizing city visit order and a map illustrating city locations and routes. The scatter plot shows a negative correlation between normalized energy and I0. The heatmaps display different patterns of city visit order, and the map shows a route connecting five cities.
### Components/Axes
**1. Scatter Plot:**
* **X-axis:** I0 (logarithmic scale). Axis markers are approximately 10^-1, 10^0, and 10^1.
* **Y-axis:** Normalized energy. Axis markers are 0, 0.2, 0.4, 0.6, 0.8, and 1.
* **Data:** Blue dots representing data points.
**2. Heatmaps (Bottom Row):**
* **X-axis:** Order of city visits (1, 2, 3, 4).
* **Y-axis:** City Number (1, 2, 3, 4).
* **Color Scale:** Ranges from -1 (dark blue) to 1 (yellow).
* **Heatmap 1 (Left):** Shows a gradient of colors, indicating varying degrees of correlation or interaction between city number and visit order.
* **Heatmap 2 (Middle):** Shows a more discrete pattern with predominantly blue and some green/yellow squares.
* **Heatmap 3 (Right):** Shows a distinct pattern with yellow squares along the diagonal and blue squares elsewhere.
**3. Map (Top-Right):**
* Shows a geographical map of the United States.
* Five cities are marked with numbers 0, 1, 2, 3, and 4.
* Red lines connect the cities, indicating a route.
### Detailed Analysis
**1. Scatter Plot:**
* The blue data points form a dense cloud that decreases rapidly as I0 increases from approximately 0.01 to 0.1.
* As I0 increases from 0.1 to 1, the density of data points decreases, and the normalized energy approaches 0.
* The trend is a negative correlation between normalized energy and I0.
**2. Heatmaps:**
* **Heatmap 1:**
* City 1: Shows a gradient from green to yellow as the order of visits increases.
* City 2: Shows a gradient from green to yellow as the order of visits increases.
* City 3: Shows a gradient from orange to yellow as the order of visits increases.
* City 4: Shows a gradient from green to yellow as the order of visits increases.
* **Heatmap 2:**
* City 1: Visit order 1 is green, the rest are blue.
* City 2: Visit order 3 is green, the rest are blue.
* City 3: Visit order 2 is green, the rest are blue.
* City 4: Visit order 4 is green, the rest are blue.
* **Heatmap 3:**
* City 1: Visit order 1 is yellow, the rest are blue.
* City 2: Visit order 2 is yellow, the rest are blue.
* City 3: Visit order 3 is yellow, the rest are blue.
* City 4: Visit order 4 is yellow, the rest are blue.
**3. Map:**
* City 0 is located in the northeastern United States.
* City 1 is located on the east coast.
* City 2 is located in California.
* City 3 is located in the southwestern United States.
* City 4 is located in the northwestern United States.
* The route connects the cities in the order 0 -> 1 -> 3 -> 2 -> 4 -> 0.
### Key Observations
* The scatter plot shows a clear negative correlation between normalized energy and I0.
* The heatmaps display different patterns of city visit order, suggesting different optimization strategies or constraints.
* The map provides a geographical context for the city visit order.
### Interpretation
The data suggests that as the parameter I0 increases, the normalized energy decreases. This could indicate that a higher value of I0 leads to a more efficient or stable state. The heatmaps provide insights into the relationship between city number and visit order, potentially reflecting different optimization strategies for the traveling salesman problem or a similar routing problem. The map provides a visual representation of the cities and the route connecting them, allowing for a better understanding of the geographical context of the problem. The different patterns in the heatmaps could represent different stages of an optimization process or different solutions to the problem. Heatmap 3, with the yellow diagonal, suggests a scenario where each city is visited in its corresponding order (City 1 is visited first, City 2 is visited second, etc.).