\n
## Line Chart: Response Time vs. Amount
### Overview
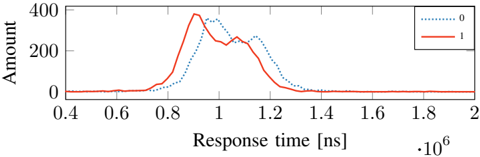
The image presents a line chart illustrating the relationship between Response Time (in nanoseconds) and Amount. Two distinct data series are plotted, likely representing different conditions or categories. The chart appears to show the distribution of "Amount" over a range of "Response Time" values.
### Components/Axes
* **X-axis:** "Response time [ns] ⋅10⁶". Scale ranges from approximately 0.4 to 2.0, with tick marks at 0.6, 0.8, 1.0, 1.2, 1.4, 1.6, 1.8, and 2.0.
* **Y-axis:** "Amount". Scale ranges from 0 to 400, with tick marks at 0, 100, 200, 300, and 400.
* **Legend:** Located in the top-right corner.
* "0" - Represented by a dotted blue line.
* "1" - Represented by a solid red line.
### Detailed Analysis
* **Data Series 0 (Blue Dotted Line):** This line starts at approximately 0 at a response time of 0.4 ns. It increases gradually, reaching a peak of approximately 320 at a response time of around 0.95 ns. After the peak, the line decreases rapidly, crossing the 0 amount level around 1.3 ns. It remains near 0 for the rest of the plotted range.
* **Data Series 1 (Red Solid Line):** This line starts at approximately 0 at a response time of 0.4 ns. It increases sharply, reaching a peak of approximately 390 at a response time of around 0.9 ns. The line then decreases more gradually than Data Series 0, reaching approximately 230 at 1.1 ns, and then continues to decrease, approaching 0 around 1.6 ns. It remains near 0 for the rest of the plotted range.
### Key Observations
* Both data series exhibit a similar trend: an initial increase followed by a decrease.
* Data Series 1 (red line) has a higher peak amount and a slower decay compared to Data Series 0 (blue line).
* The peak of Data Series 1 occurs slightly earlier in time than the peak of Data Series 0.
* Both series converge to approximately 0 amount at higher response times.
### Interpretation
The chart likely represents the distribution of some event or quantity ("Amount") as a function of the time it takes to respond ("Response Time"). The two data series could represent different conditions or treatments.
The higher peak and slower decay of Data Series 1 suggest that, under condition "1", the event occurs more frequently and persists for a longer duration compared to condition "0". The initial faster rise of Data Series 1 could indicate a quicker initial response. The convergence of both series at higher response times suggests that, eventually, the event becomes negligible regardless of the condition.
The chart could be illustrating the response of a system to a stimulus, the decay of a signal, or the distribution of reaction times in an experiment. Without further context, it's difficult to determine the precise meaning of the data, but the chart clearly demonstrates a difference in the temporal characteristics of the event under the two conditions.