## Diagram: Causal Relationship Diagram
### Overview
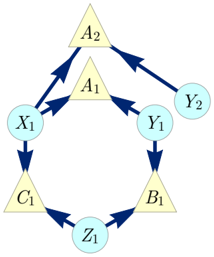
This image depicts a directed acyclic graph (DAG) illustrating causal relationships between various nodes. The nodes are represented by circles and triangles, and the causal influences are indicated by directed arrows.
### Components/Axes
There are no explicit axes or legends in this diagram. The components are:
* **Circular Nodes (Light Blue):**
* X1
* Y1
* Z1
* Y2
* **Triangular Nodes (Yellow):**
* A1
* A2
* B1
* C1
### Detailed Analysis or Content Details
The diagram shows the following directed causal relationships:
* **X1** influences **A1** (arrow from X1 to A1).
* **X1** influences **C1** (arrow from X1 to C1).
* **A1** influences **A2** (arrow from A1 to A2).
* **A1** influences **Y1** (arrow from A1 to Y1).
* **Y1** influences **B1** (arrow from Y1 to B1).
* **B1** influences **Z1** (arrow from B1 to Z1).
* **C1** influences **Z1** (arrow from C1 to Z1).
* **A2** influences **Y2** (arrow from A2 to Y2).
* **A2** influences **A1** (arrow from A2 to A1). This indicates a feedback loop or a cyclical dependency if interpreted as a standard DAG, but in causal inference, this might represent a specific modeling choice.
### Key Observations
* The diagram represents a network of interconnected variables.
* There are both direct and indirect influences shown. For example, X1 indirectly influences Z1 through A1, Y1, and B1, or through C1.
* The presence of an arrow from A2 back to A1 suggests a potential feedback mechanism or a complex temporal dependency that might require careful interpretation in a causal context.
### Interpretation
This diagram visually represents a hypothesized causal structure. The circular nodes (X1, Y1, Z1, Y2) might represent observed variables or outcomes, while the triangular nodes (A1, A2, B1, C1) could represent latent variables, treatment assignments, or intermediate causal steps.
The arrows indicate the direction of presumed causal influence. For instance, it is suggested that X1 has a direct causal effect on both A1 and C1. A1, in turn, influences A2 and Y1. The relationship from A2 back to A1 is particularly noteworthy. In a strict DAG, cycles are not permitted. However, in some causal modeling frameworks, such as those involving feedback loops or dynamic systems, such connections might be used to represent specific phenomena. If this is intended as a standard DAG for causal inference, the A2 -> A1 arrow would imply that the diagram is not strictly a DAG, or that A1 and A2 are not distinct time points or distinct causal entities in the way typically assumed.
The overall structure suggests a system where initial causes (like X1) propagate through a series of intermediate factors (A1, A2, B1, C1) to affect outcomes (Y1, Z1, Y2). The presence of multiple pathways to Z1 (via B1 and C1) indicates potential for confounding or mediation analysis. The interpretation of this diagram would heavily depend on the specific domain and the definitions of the variables represented by the nodes.