## Flowchart Diagram: System Process Flow
### Overview
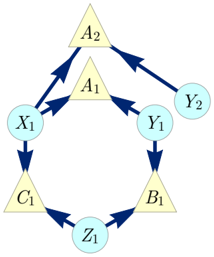
The image depicts a directed graph (flowchart) with labeled nodes and directional arrows. The diagram illustrates a process flow involving decision points (triangles) and data/process nodes (circles). Arrows indicate the direction of flow or dependency between components.
### Components/Axes
- **Nodes**:
- **Triangles** (likely decision points or actions): `A1`, `A2`, `B1`, `C1`
- **Circles** (likely data/process nodes): `X1`, `Y1`, `Y2`, `Z1`
- **Arrows**: Blue directional arrows connecting nodes, indicating flow or relationships.
- **No explicit legend, axis titles, or scales** (typical for flowcharts).
### Detailed Analysis
1. **Node Connections**:
- `A2` → `A1` and `A2` → `Y2`
- `A1` → `X1` and `A1` → `Y1`
- `Y1` → `B1`
- `B1` → `Z1`
- `Z1` → `C1`
- `C1` → `A1` (feedback loop)
- `X1` → `C1`
2. **Structure**:
- **Top-level nodes**: `A2` (root) and `Y2` (terminal node).
- **Central loop**: `A1` → `Y1` → `B1` → `Z1` → `C1` → `A1`.
- **Parallel path**: `A1` → `X1` → `C1` (shortcut to the loop).
3. **Color Coding**:
- Triangles: Light yellow (decision/action nodes).
- Circles: Light blue (data/process nodes).
- Arrows: Dark blue (flow direction).
### Key Observations
- **Feedback Loop**: `C1` → `A1` creates a cyclical dependency, suggesting iterative processing.
- **Divergence**: `A2` splits into two paths (`A1` and `Y2`), indicating branching logic.
- **Convergence**: `X1` and `Z1` both feed into `C1`, merging data/process streams.
- **Terminal Node**: `Y2` has no outgoing arrows, acting as an endpoint.
### Interpretation
This flowchart represents a system with **modular decision-making** and **data flow**. The feedback loop between `A1` and `C1` implies a recurring process (e.g., validation, iteration). The divergence at `A2` suggests conditional branching (e.g., `A2` determines whether to proceed via `A1` or terminate at `Y2`). The convergence at `C1` indicates integration of inputs from `X1` and `Z1`, which may represent parallel subsystems or data sources. The terminal node `Y2` could represent an exit condition or output. The diagram emphasizes **cyclic dependencies** and **modularity**, common in workflows like software pipelines, decision trees, or state machines.