## Line Graph: Performance Metrics vs Decoder Input
### Overview
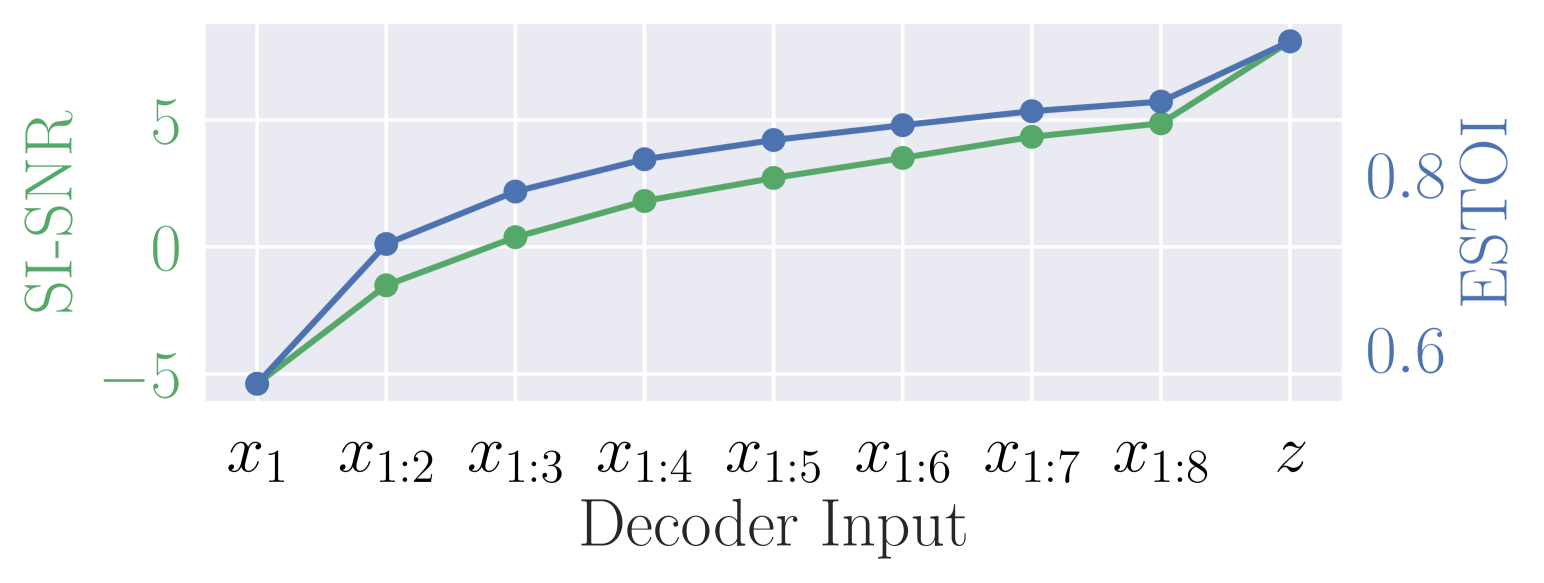
The image depicts a line graph comparing two performance metrics (SI-SNR and ESTOI) across sequential decoder inputs labeled from **x₁** to **z**. Two lines are plotted: a blue line representing **SI-SNR** and a green line representing **ESTOI**. Both metrics show an upward trend as decoder input complexity increases, with SI-SNR consistently outperforming ESTOI.
---
### Components/Axes
- **X-Axis (Decoder Input)**:
Labels include **x₁**, **x₁:2**, **x₁:3**, **x₁:4**, **x₁:5**, **x₁:6**, **x₁:7**, **x₁:8**, and **z**. These likely represent incremental decoder input configurations or stages.
- **Y-Axes**:
- **Left Y-Axis (SI-SNR)**: Ranges from **-5** to **5** in increments of 5.
- **Right Y-Axis (ESTOI)**: Ranges from **0.6** to **0.8** in increments of 0.1.
- **Legend**:
Located on the right side of the graph.
- **Blue line**: SI-SNR (Signal-to-Interference-plus-Noise Ratio).
- **Green line**: ESTOI (Extended Short-Time Objective Intelligibility).
- **Data Points**:
Marked with circular symbols (○) at each x-axis label.
---
### Detailed Analysis
1. **SI-SNR (Blue Line)**:
- Starts at **-5** for **x₁** and increases steadily to **5** at **z**.
- Notable jumps occur between **x₁:2** (≈0) and **x₁:3** (≈3).
- Slope is steeper in the latter half of the graph.
2. **ESTOI (Green Line)**:
- Begins at **0.6** for **x₁** and rises to **0.8** at **z**.
- Growth is more gradual compared to SI-SNR, with smaller increments (e.g., **x₁:3** ≈ 0.65, **x₁:7** ≈ 0.75).
- ESTOI remains below SI-SNR throughout, with both metrics reaching their respective maxima at **z**.
3. **Trends**:
- Both metrics improve monotonically with increasing decoder input.
- SI-SNR consistently outperforms ESTOI, as they are measured on different scales.
---
### Key Observations
- **Performance Correlation**: Higher decoder input complexity (e.g., **x₁:8** to **z**) correlates with significant improvements in both metrics.
- **Metric Divergence**: SI-SNR outperforms ESTOI, suggesting it may be a more sensitive indicator of signal quality.
- **Saturation Point**: Both metrics reach their maximum values at **z**, indicating potential saturation or diminishing gains at higher input levels.
---
### Interpretation
The graph demonstrates that decoder input complexity directly impacts signal quality metrics. SI-SNR’s steeper growth suggests it captures finer details of signal degradation, while ESTOI’s slower rise may reflect its focus on perceptual speech intelligibility. The saturation at **z** (both metrics at their maxima) implies that beyond a certain input complexity, further improvements yield marginal benefits for both metrics. This aligns with principles of signal processing, where optimal performance often plateaus due to hardware or algorithmic limitations.
**Note**: All values are approximate, derived from visual estimation of the plotted points.