\n
## Heatmap: MIND - Short-to-Long - Qwen-2.5 7B
### Overview
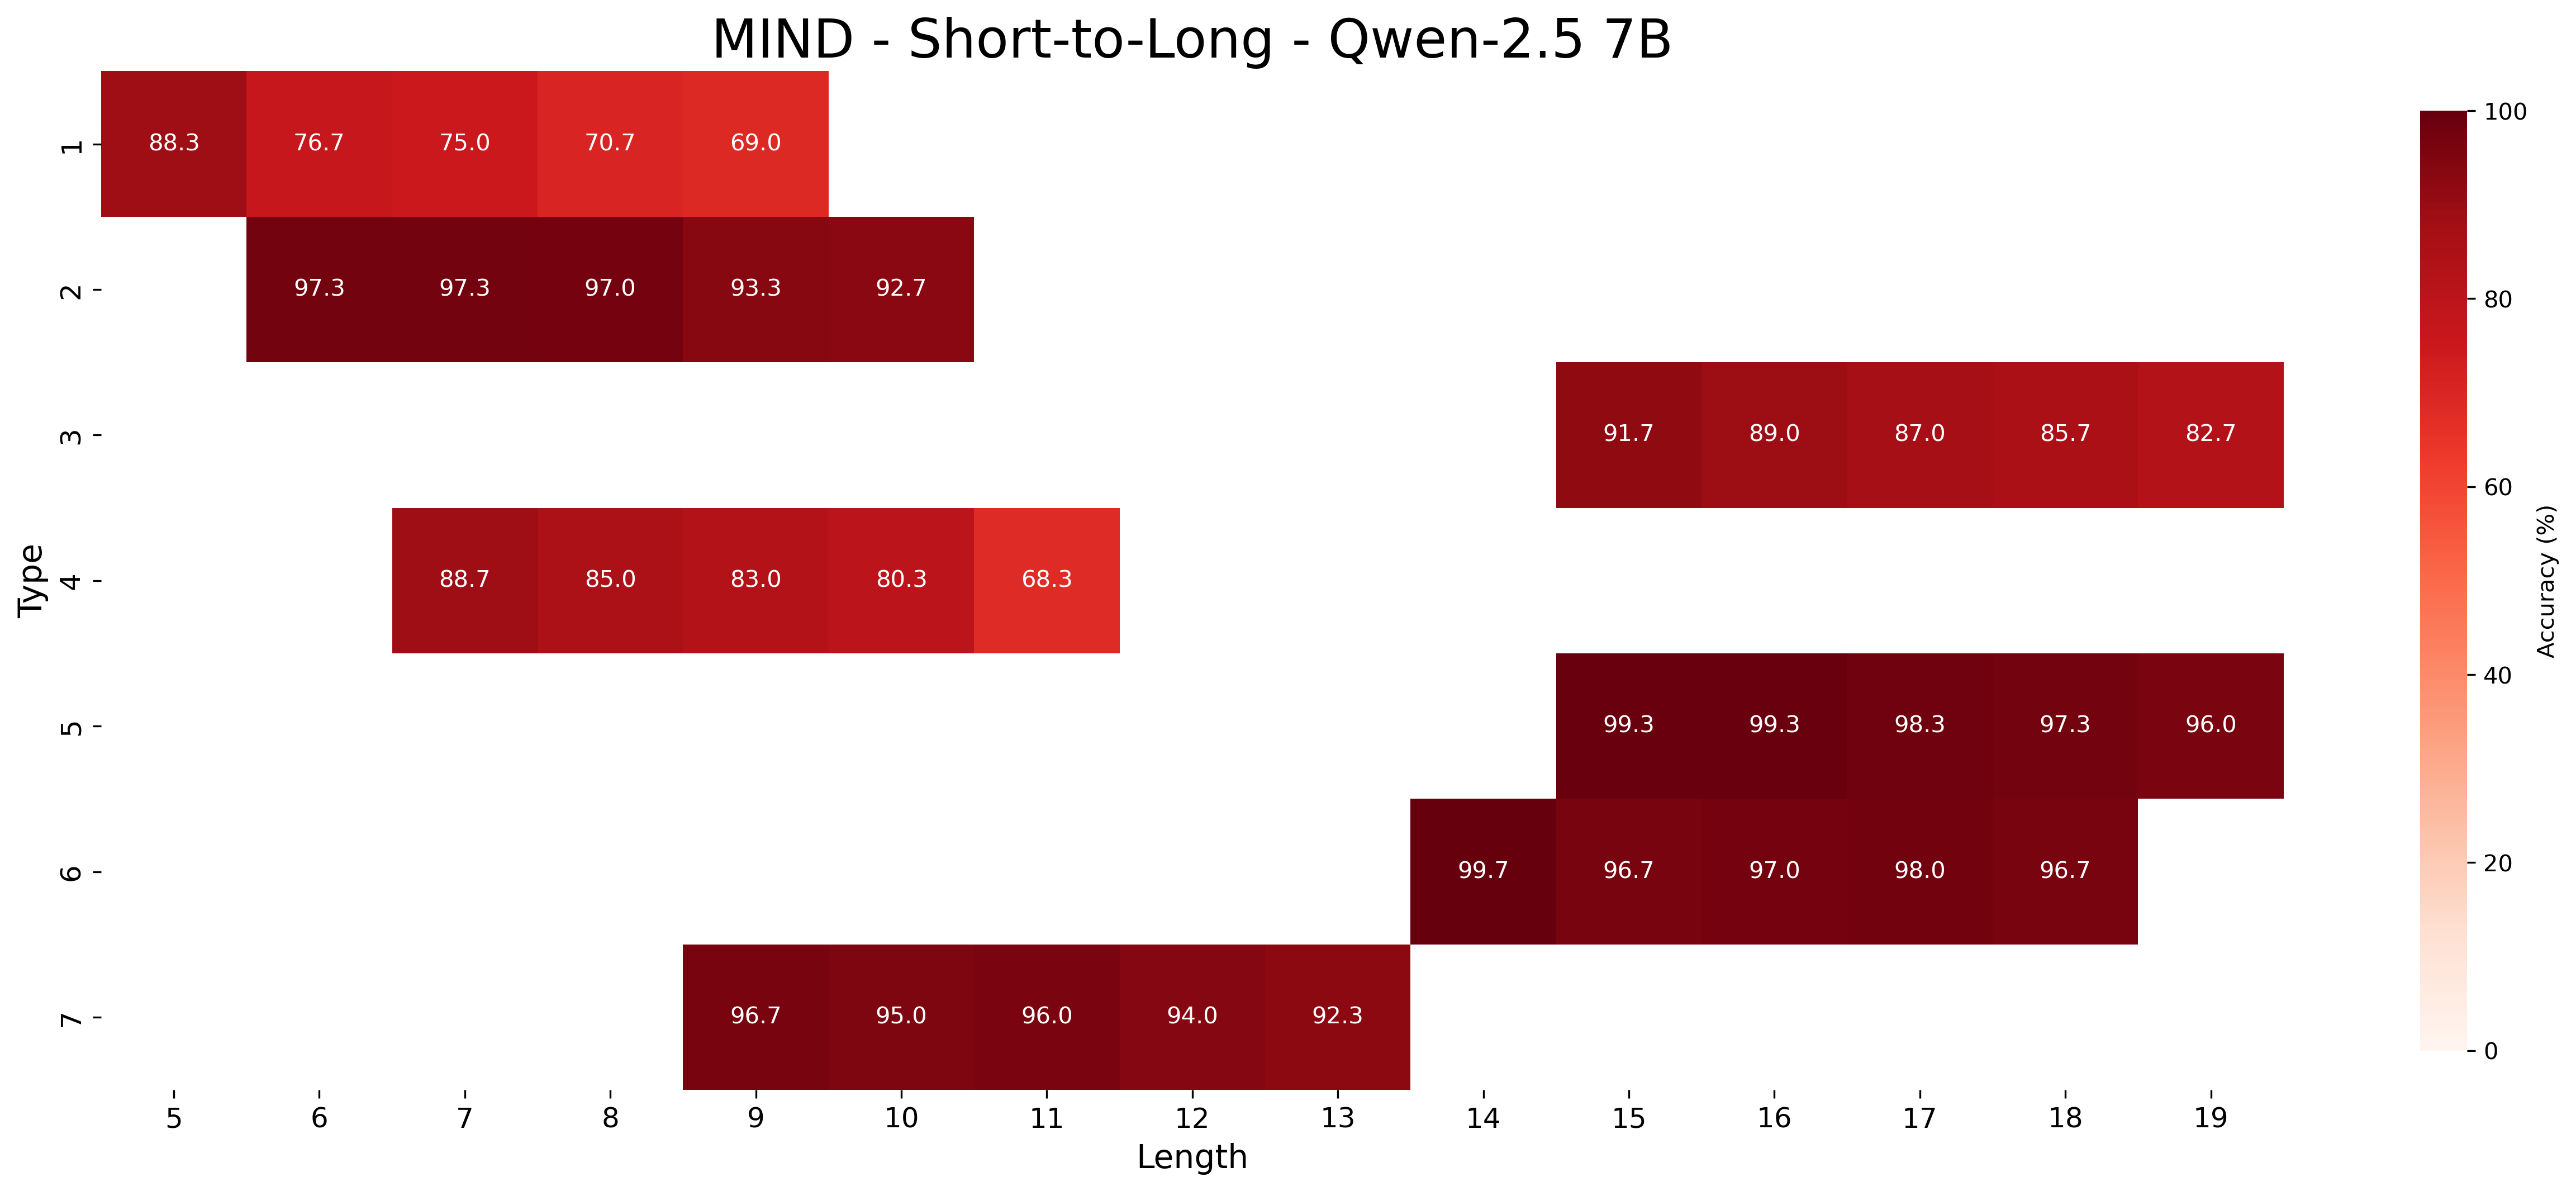
This image presents a heatmap visualizing the accuracy of a model (Qwen-2.5 7B) on a dataset called "MIND" for short-to-long tasks. The heatmap displays accuracy as a function of "Type" (ranging from 1 to 7) and "Length" (ranging from 5 to 19). The color intensity represents the accuracy percentage, with darker shades indicating higher accuracy.
### Components/Axes
* **Title:** MIND - Short-to-Long - Qwen-2.5 7B (positioned at the top-center)
* **X-axis:** Length (ranging from 5 to 19, with increments of 1). Labeled at the bottom.
* **Y-axis:** Type (ranging from 1 to 7, with increments of 1). Labeled on the left.
* **Colorbar:** A vertical colorbar on the right side represents Accuracy (%) ranging from 0 to 100.
* **Data Points:** Each cell in the heatmap represents the accuracy for a specific combination of Type and Length. The values are displayed within each cell.
### Detailed Analysis
The heatmap consists of 7 rows (Types 1-7) and 15 columns (Lengths 5-19). The color gradient ranges from light beige (low accuracy) to dark red (high accuracy).
Here's a breakdown of the accuracy values, organized by Type and Length:
* **Type 1:**
* Length 5: 88.3%
* Length 6: 76.7%
* Length 7: 70.0%
* Length 8: 69.0%
* **Type 2:**
* Length 5: 97.3%
* Length 6: 97.0%
* Length 7: 97.0%
* Length 8: 93.3%
* Length 9: 92.7%
* **Type 3:**
* Length 13: 91.7%
* Length 14: 89.0%
* Length 15: 87.0%
* Length 16: 85.7%
* Length 17: 82.7%
* **Type 4:**
* Length 5: 88.7%
* Length 6: 85.0%
* Length 7: 83.0%
* Length 8: 80.3%
* Length 9: 68.3%
* **Type 5:**
* Length 14: 99.3%
* Length 15: 98.3%
* Length 16: 97.3%
* Length 17: 96.0%
* **Type 6:**
* Length 14: 99.7%
* Length 15: 97.0%
* Length 16: 98.0%
* Length 17: 96.7%
* **Type 7:**
* Length 9: 96.7%
* Length 10: 95.0%
* Length 11: 96.0%
* Length 12: 94.0%
* Length 13: 92.3%
**Trends:**
* For Type 1, accuracy decreases as length increases from 5 to 8.
* For Type 2, accuracy remains very high (above 92%) across all lengths.
* For Type 3, accuracy decreases as length increases from 13 to 17.
* For Type 4, accuracy decreases as length increases from 5 to 9.
* For Types 5, 6, and 7, accuracy is generally very high, with some fluctuations.
### Key Observations
* Type 2 consistently exhibits the highest accuracy across all lengths.
* Type 1 and Type 4 show a negative correlation between length and accuracy.
* Types 5, 6, and 7 demonstrate high accuracy, particularly at longer lengths (14-17).
* The heatmap is not fully populated; there are gaps in the data, particularly for Type 3, 4, 5, 6, and 7 at shorter lengths.
### Interpretation
The heatmap illustrates the performance of the Qwen-2.5 7B model on the MIND dataset for short-to-long tasks, categorized by "Type" and "Length". The data suggests that the model performs exceptionally well on Type 2 tasks, regardless of length. The decreasing accuracy with increasing length for Types 1 and 4 might indicate that the model struggles with longer sequences within those specific task types. The gaps in the data suggest that certain combinations of Type and Length were not evaluated or are not relevant to the study. The high accuracy for Types 5, 6, and 7 at longer lengths suggests the model is capable of handling more complex tasks when the input length is sufficient. The colorbar provides a clear visual representation of the accuracy range, allowing for quick identification of high- and low-performing areas. The heatmap is a valuable tool for understanding the model's strengths and weaknesses and for identifying areas where further improvement is needed.