## Heatmap Chart: MIND - Short-to-Long - Qwen-2.5 7B
### Overview
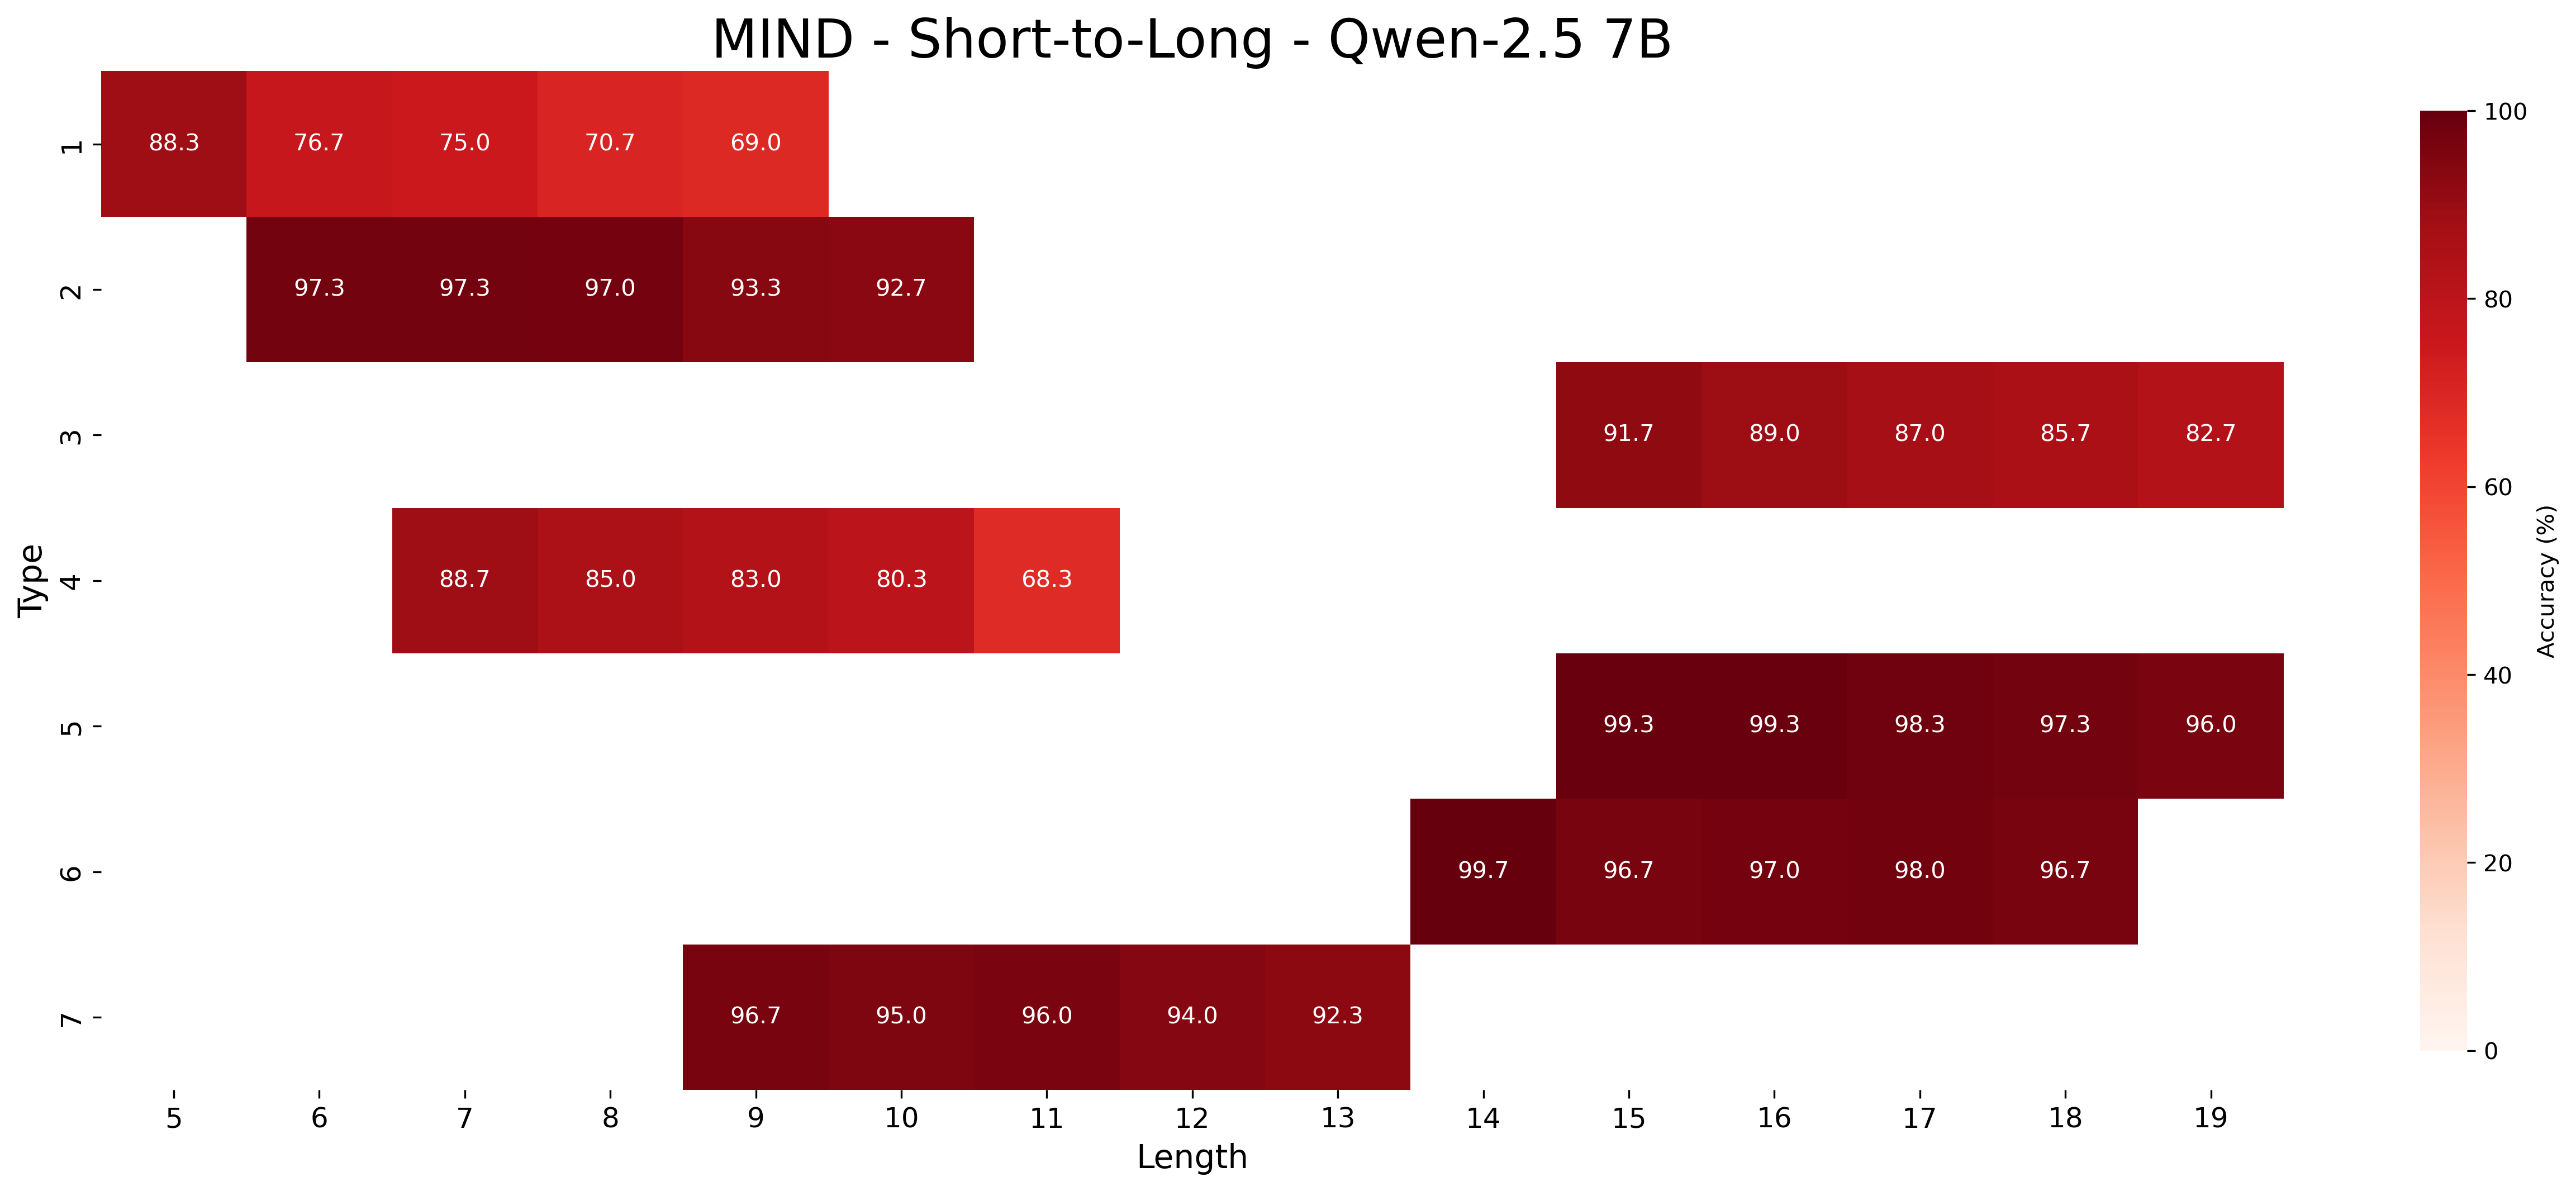
This image is a heatmap chart visualizing the accuracy performance of the "Qwen-2.5 7B" model on a task or dataset referred to as "MIND" under a "Short-to-Long" evaluation paradigm. The chart plots accuracy percentages across two dimensions: "Type" (vertical axis) and "Length" (horizontal axis). The data is presented as a grid of colored cells, where the color intensity corresponds to the accuracy value, with a legend on the right providing the scale.
### Components/Axes
* **Title:** "MIND - Short-to-Long - Qwen-2.5 7B" (centered at the top).
* **Vertical Axis (Y-axis):** Labeled "Type". It contains discrete categories numbered 1 through 7.
* **Horizontal Axis (X-axis):** Labeled "Length". It contains discrete numerical values from 5 to 19.
* **Color Bar/Legend:** Located on the right side of the chart. It is a vertical gradient bar labeled "Accuracy (%)". The scale runs from 0 (lightest, near-white) to 100 (darkest, deep red). Major tick marks are at 0, 20, 40, 60, 80, and 100.
* **Data Grid:** The main area consists of rectangular cells. Each cell contains a numerical value representing the accuracy percentage for a specific Type-Length combination. Cells are only present where data exists; many Type-Length combinations have no data (blank/white space).
### Detailed Analysis
The following table reconstructs the data from the heatmap. Values are accuracy percentages. A dash (`-`) indicates no data cell exists for that Type-Length combination.
| Type | Length 5 | Length 6 | Length 7 | Length 8 | Length 9 | Length 10 | Length 11 | Length 12 | Length 13 | Length 14 | Length 15 | Length 16 | Length 17 | Length 18 | Length 19 |
| :--- | :--- | :--- | :--- | :--- | :--- | :--- | :--- | :--- | :--- | :--- | :--- | :--- | :--- | :--- | :--- |
| **1** | 88.3 | 76.7 | 75.0 | 70.7 | 69.0 | - | - | - | - | - | - | - | - | - | - |
| **2** | - | 97.3 | 97.3 | 97.0 | 93.3 | 92.7 | - | - | - | - | - | - | - | - | - |
| **3** | - | - | - | - | - | - | - | - | - | 91.7 | 89.0 | 87.0 | 85.7 | 82.7 | - |
| **4** | - | - | 88.7 | 85.0 | 83.0 | 80.3 | 68.3 | - | - | - | - | - | - | - | - |
| **5** | - | - | - | - | - | - | - | - | - | 99.3 | 99.3 | 98.3 | 97.3 | 96.0 | - |
| **6** | - | - | - | - | - | - | - | - | 99.7 | 96.7 | 97.0 | 98.0 | 96.7 | - | - |
| **7** | - | - | - | - | 96.7 | 95.0 | 96.0 | 94.0 | 92.3 | - | - | - | - | - | - |
**Spatial & Color Grounding:**
* The highest accuracy values (99.7, 99.3) are found in the darkest red cells, located in the lower-right quadrant of the populated data (Type 6, Length 13 and Type 5, Length 14/15).
* The lowest accuracy value (68.3) is in a lighter red cell, located at Type 4, Length 11.
* The data is not a complete matrix. Each "Type" has a contiguous block of data across a specific range of "Lengths":
* Type 1: Lengths 5-9
* Type 2: Lengths 6-10
* Type 3: Lengths 14-18
* Type 4: Lengths 7-11
* Type 5: Lengths 14-18
* Type 6: Lengths 13-17
* Type 7: Lengths 9-13
### Key Observations
1. **Performance Stratification by Type:** There is a clear separation in performance levels between different Types. Types 5 and 6 consistently show very high accuracy (mostly >96%). Types 2 and 7 also show high accuracy (>92%). Type 3 shows moderate accuracy (82.7-91.7%). Types 1 and 4 show the lowest and most variable accuracy.
2. **Length Sensitivity:** For most Types, accuracy tends to decrease as the "Length" value increases within its data block. This downward trend is most pronounced in Type 1 (88.3% to 69.0%) and Type 4 (88.7% to 68.3%).
3. **Anomaly in Type 6:** Type 6 shows a non-monotonic trend. Accuracy starts at 99.7% (Length 13), dips to 96.7% (Length 14), then rises again to 98.0% (Length 17) before a final dip. This suggests a potential outlier or a specific length where performance is exceptionally high.
4. **Data Coverage:** The "Length" axis is not uniformly covered for all Types. Shorter lengths (5-11) are primarily associated with Types 1, 2, 4, and 7. Longer lengths (13-18) are associated with Types 3, 5, and 6. This suggests the "Short-to-Long" evaluation may involve different task types being relevant at different length scales.
### Interpretation
This heatmap provides a diagnostic view of the Qwen-2.5 7B model's capabilities on the MIND benchmark. The "Type" axis likely represents different sub-tasks, question categories, or reasoning skills within the MIND evaluation. The "Length" axis likely corresponds to input sequence length, context window size, or the complexity/number of steps in a problem.
The data suggests that the model's performance is highly dependent on the specific task type. It excels at certain tasks (Types 5 & 6) even with long inputs, indicating robust capabilities in those areas. Conversely, it struggles with other tasks (Types 1 & 4), and its performance degrades significantly as the problem length increases, pointing to a potential weakness in handling long-context reasoning or information retention for those specific task types.
The segmented nature of the data (each Type occupying a specific length range) implies that the "Short-to-Long" evaluation might be structured such that different cognitive challenges (represented by Types) become prominent at different scales. The model's strong performance on longer-length tasks (Types 3, 5, 6) is a positive indicator for its long-context abilities, but the poor performance on shorter-length tasks of Types 1 and 4 highlights areas for improvement. The anomaly in Type 6 warrants further investigation to understand why performance peaks at a specific length.