\n
## Radar Charts: Token Efficiency before and after Toggle across Benchmarks
### Overview
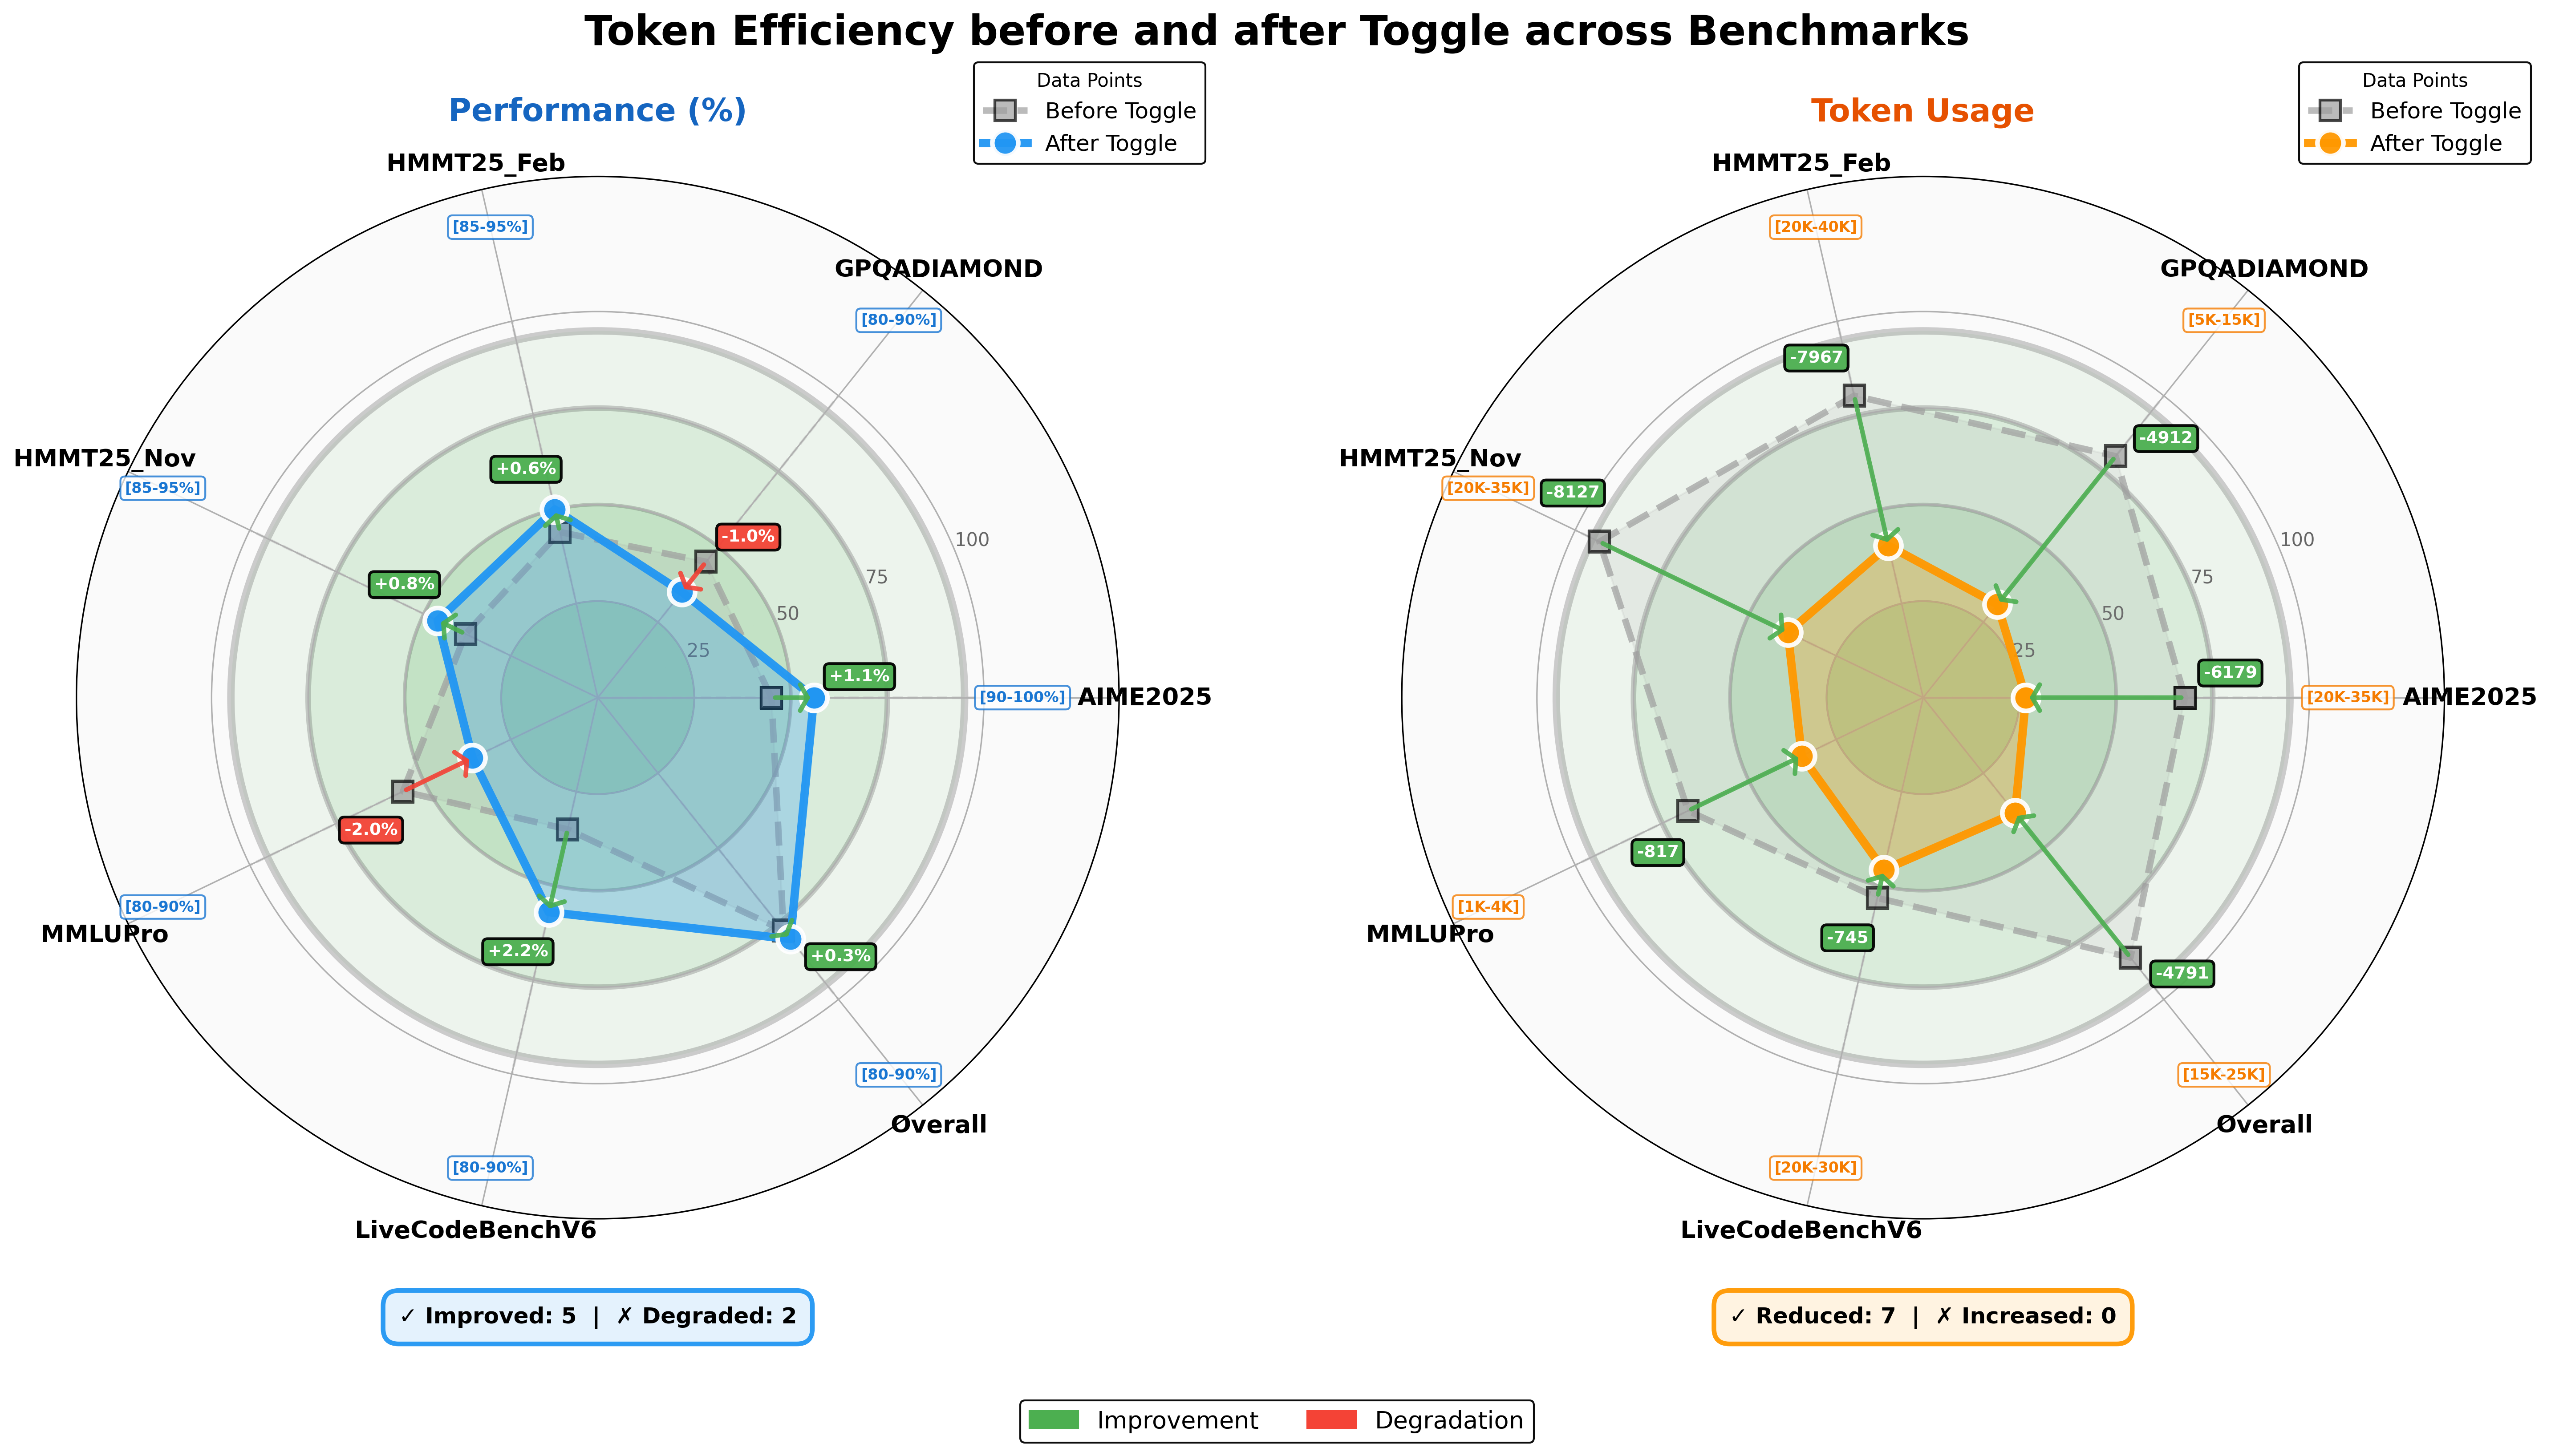
The image presents two radar charts comparing "Token Efficiency" (Performance in %) and "Token Usage" across several benchmarks before and after a "Toggle" is applied. The benchmarks are: HMMT25_Feb, HMMT25_Nov, MMLUPro, AIME2025, GPQDIAMOND, LiveCodeBenchV6, and Overall. A summary at the bottom indicates 5 benchmarks improved and 2 degraded in performance, while 7 benchmarks reduced token usage and none increased.
### Components/Axes
* **Chart Type:** Radar Chart (Spider Chart)
* **Axis Titles:** The charts do not have explicit axis titles, but the radial axes represent the benchmarks listed above. The scale ranges from 0 to 100 for Performance (%) and appears to be in units of 10k for Token Usage.
* **Legends:** Two legends are present.
* **Performance (%) Legend:** Located in the top-left corner.
* Blue: Before Toggle
* Light Blue: After Toggle
* **Token Usage Legend:** Located in the top-right corner.
* Yellow: Before Toggle
* Orange: After Toggle
* **Benchmarks (Categories):** HMMT25_Feb, HMMT25_Nov, MMLUPro, AIME2025, GPQDIAMOND, LiveCodeBenchV6, Overall.
* **Indicators:** Improvement (Green) and Degradation (Red) indicators at the bottom.
### Detailed Analysis or Content Details
**Performance (%) - Left Chart**
* **HMMT25_Feb:** Before Toggle: ~85-95%. After Toggle: ~90-95% (+6.6%).
* **HMMT25_Nov:** Before Toggle: ~85-95%. After Toggle: ~90-95% (+0.8%).
* **MMLUPro:** Before Toggle: ~80-90%. After Toggle: ~80-90% (-2.0%).
* **AIME2025:** Before Toggle: ~90-100%. After Toggle: ~90-100% (+1.1%).
* **GPQDIAMOND:** Before Toggle: ~80-90%. After Toggle: ~80-90% (+0.3%).
* **LiveCodeBenchV6:** Before Toggle: ~80-90%. After Toggle: ~80-90% (+2.2%).
* **Overall:** Before Toggle: ~80-90%. After Toggle: ~80-90% (+0.3%).
**Token Usage - Right Chart**
* **HMMT25_Feb:** Before Toggle: ~200k-350k. After Toggle: ~7967.
* **HMMT25_Nov:** Before Toggle: ~200k-350k. After Toggle: ~8127.
* **MMLUPro:** Before Toggle: ~110k-150k. After Toggle: ~745.
* **AIME2025:** Before Toggle: ~200k-350k. After Toggle: ~6179.
* **GPQDIAMOND:** Before Toggle: ~30k-150k. After Toggle: ~4912.
* **LiveCodeBenchV6:** Before Toggle: ~200k-300k. After Toggle: ~-817.
* **Overall:** Before Toggle: ~150k-250k. After Toggle: ~-879.
### Key Observations
* **Performance:** Most benchmarks show a slight improvement in performance after the toggle, with HMMT25_Feb showing the largest gain (+6.6%). MMLUPro shows a slight degradation (-2.0%).
* **Token Usage:** Token usage dramatically *decreased* across all benchmarks after the toggle. LiveCodeBenchV6 and Overall show negative token usage after the toggle, which is likely an artifact of the scale or data representation.
* **Correlation:** There doesn't appear to be a strong correlation between performance improvement and token usage reduction. Some benchmarks improved in performance with significant token usage reduction, while others showed minimal performance change with substantial token usage reduction.
* **Outliers:** LiveCodeBenchV6 and Overall have notably large reductions in token usage, and negative values, which warrants further investigation.
### Interpretation
The data suggests that the "Toggle" significantly reduces token usage across all benchmarks, with minimal impact on performance for most. The substantial reduction in token usage, particularly for LiveCodeBenchV6 and Overall, could indicate a more efficient model or algorithm after the toggle. The negative token usage values for these benchmarks are unusual and may represent a limitation in the data representation or a specific characteristic of those benchmarks.
The fact that most benchmarks show performance improvement alongside token usage reduction is a positive outcome, suggesting that the toggle doesn't compromise performance while making the model more efficient. The slight degradation in MMLUPro performance might indicate a trade-off or a specific sensitivity of that benchmark to the toggle.
The radar chart format effectively visualizes the relative performance and token usage across different benchmarks, allowing for a quick comparison of the impact of the toggle. The color-coding (blue/light blue and yellow/orange) clearly distinguishes between the "Before Toggle" and "After Toggle" states. The summary indicators (improvement/degradation) provide a concise overview of the overall impact.