## Radar Charts: Token Efficiency before and after Toggle across Benchmarks
### Overview
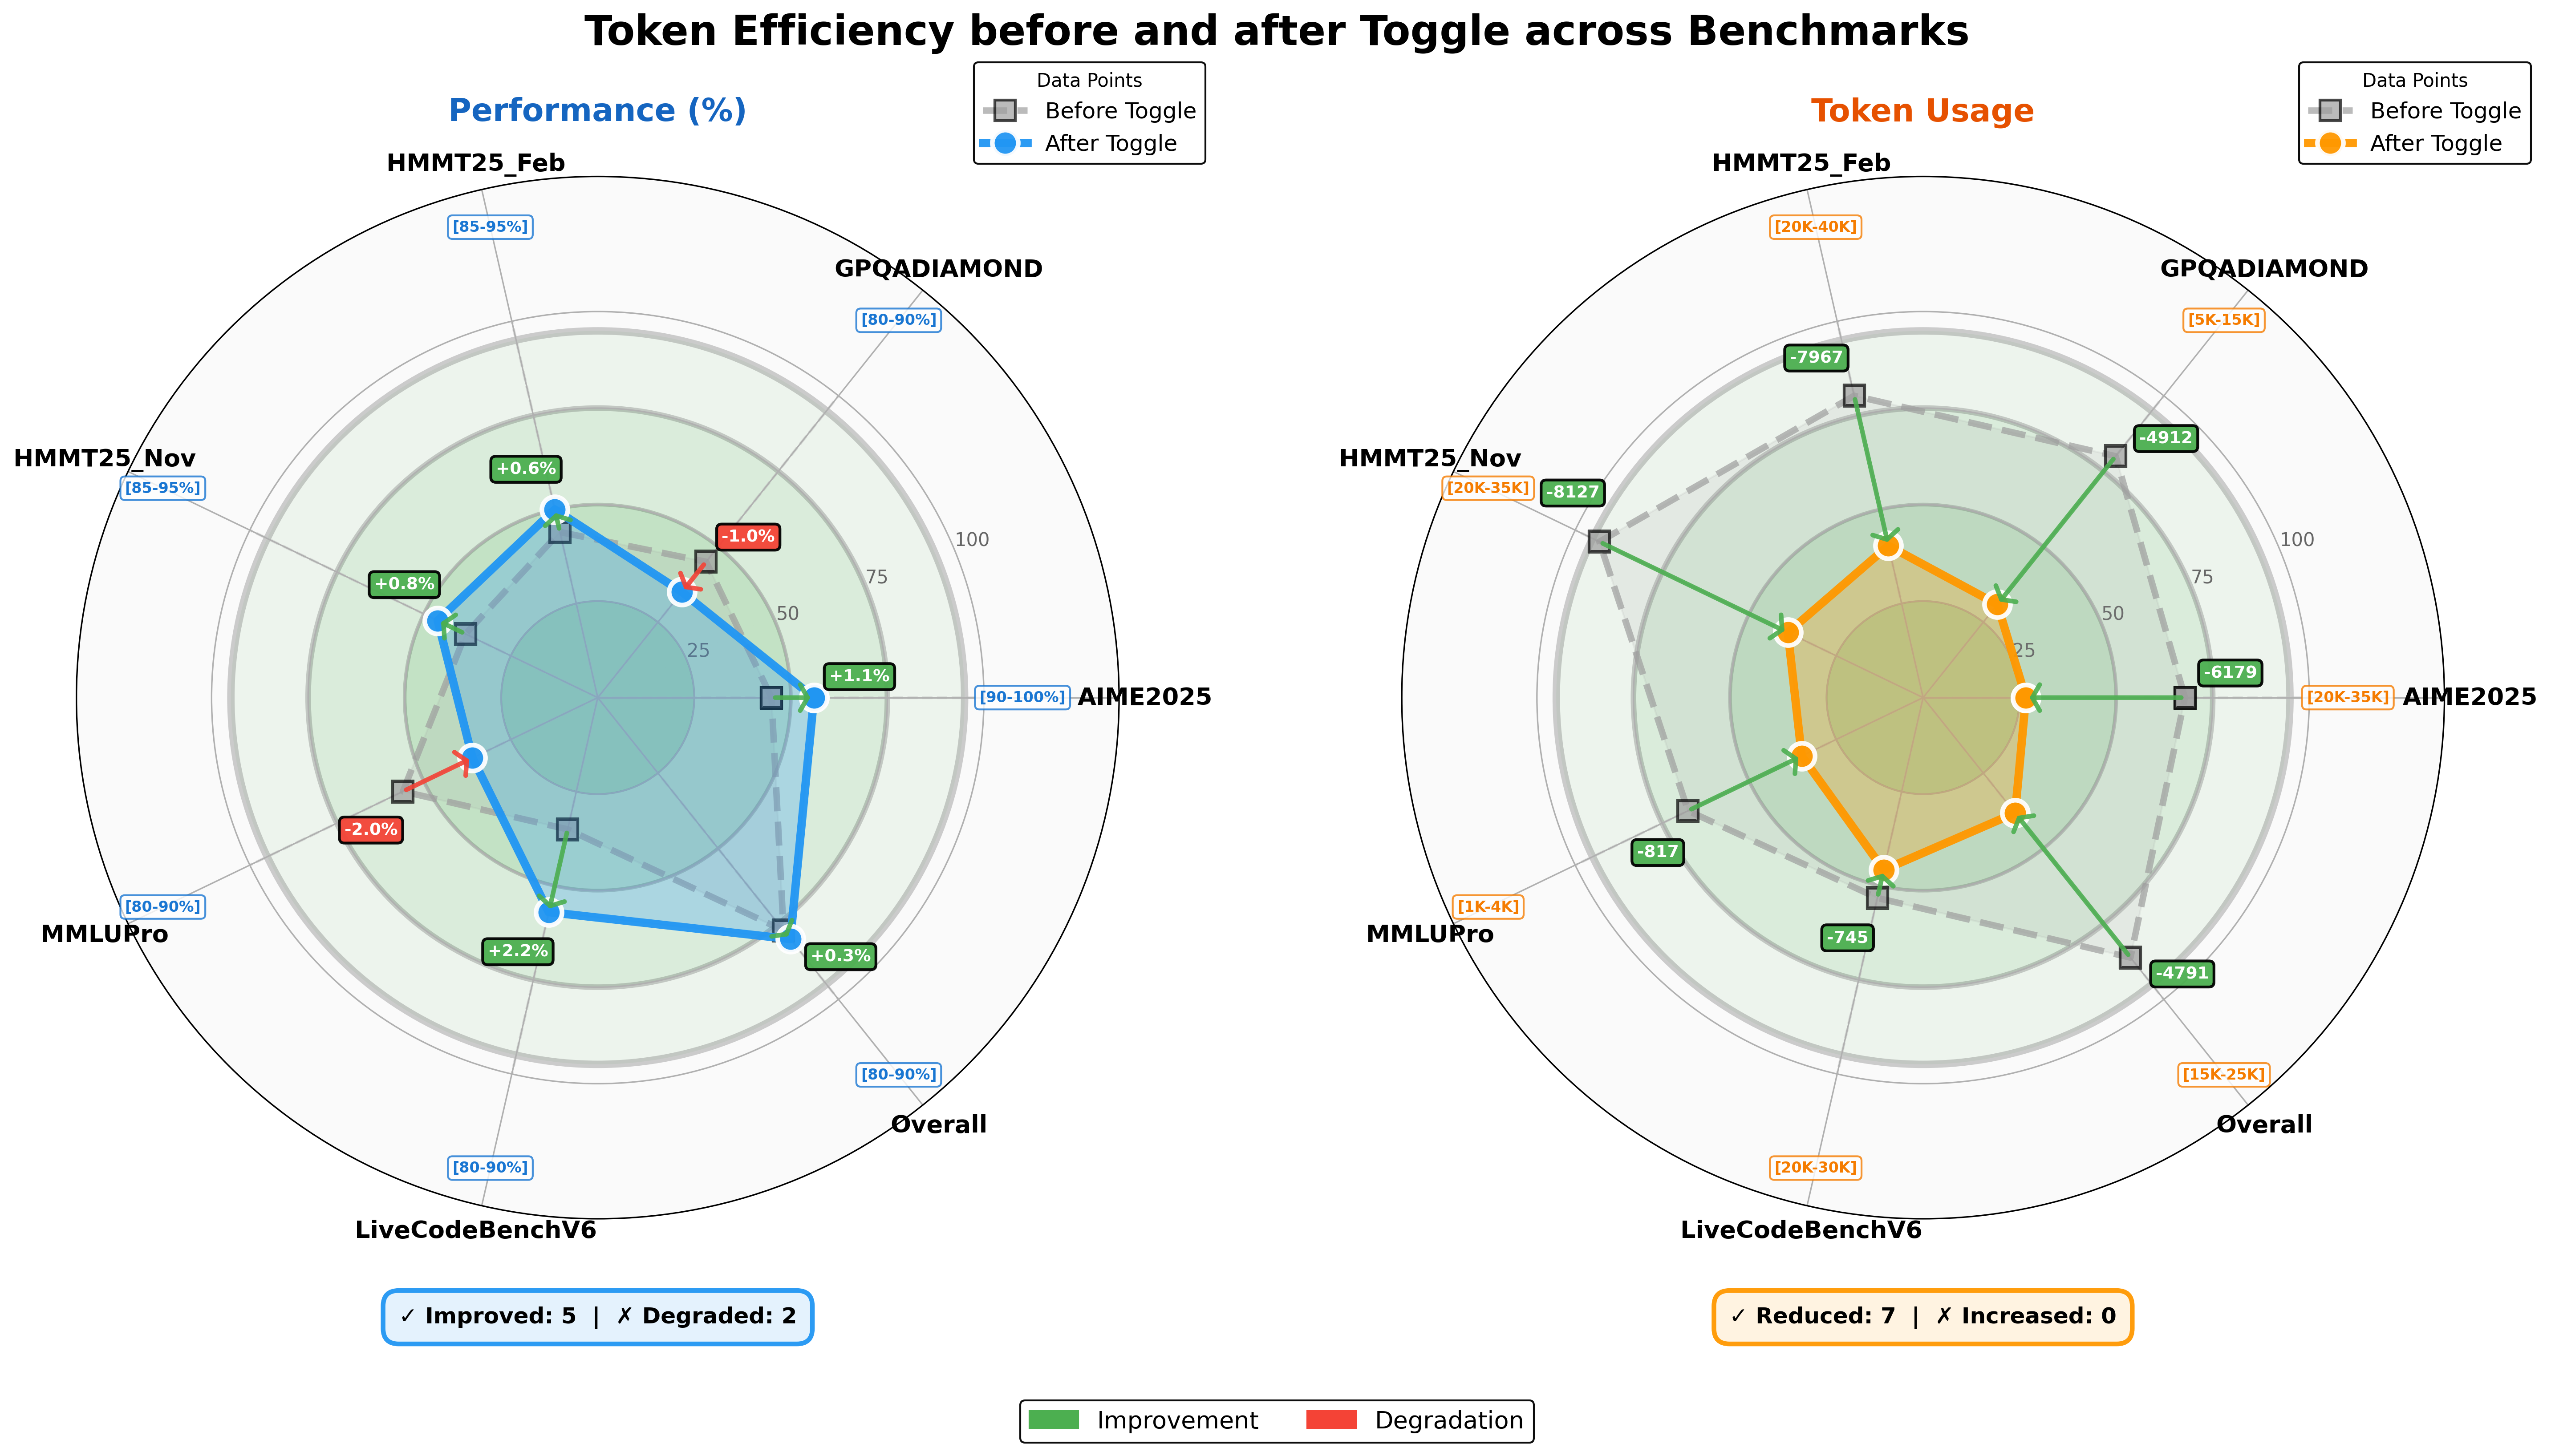
The image contains two radar charts comparing token efficiency metrics before and after a system toggle. The left chart measures **Performance (%)**, while the right chart measures **Token Usage**. Both charts use color-coded data points to represent pre-toggle (gray squares) and post-toggle (colored markers) values, with a summary of improvements/degradations at the bottom.
---
### Components/Axes
#### Left Chart: Performance (%)
- **Axes**:
- Circular axis labeled with benchmarks:
- `HMMT25_Feb` (85-95%)
- `GPQADIAMOND` (80-90%)
- `AIME2025` (90-100%)
- `MMLUPro` (80-90%)
- `LiveCodeBenchV6` (80-90%)
- `Overall` (80-90%)
- Radial scale from 0% to 100%.
- **Legend**:
- Gray squares = Before Toggle
- Blue circles = After Toggle
- **Summary**:
- ✅ Improved: 5 benchmarks
- ❌ Degraded: 2 benchmarks
#### Right Chart: Token Usage
- **Axes**:
- Circular axis labeled with benchmarks:
- `HMMT25_Feb` (20K-40K)
- `GPQADIAMOND` (5K-15K)
- `AIME2025` (20K-35K)
- `MMLUPro` (1K-4K)
- `LiveCodeBenchV6` (20K-30K)
- `Overall` (15K-25K)
- Radial scale from 0 to 100 (units unspecified).
- **Legend**:
- Gray squares = Before Toggle
- Orange circles = After Toggle
- **Summary**:
- ✅ Reduced: 7 benchmarks
- ❌ Increased: 0 benchmarks
---
### Detailed Analysis
#### Performance (%)
- **HMMT25_Feb**:
- Before: 85-95% → After: 85-95% (▲+0.6%)
- **GPQADIAMOND**:
- Before: 80-90% → After: 80-90% (▼-1.0%)
- **AIME2025**:
- Before: 90-100% → After: 90-100% (▲+1.1%)
- **MMLUPro**:
- Before: 80-90% → After: 80-90% (▼-2.0%)
- **LiveCodeBenchV6**:
- Before: 80-90% → After: 80-90% (▲+2.2%)
- **Overall**:
- Before: 80-90% → After: 80-90% (▲+0.3%)
#### Token Usage
- **HMMT25_Feb**:
- Before: 20K-40K → After: 20K-40K (▼-7967)
- **GPQADIAMOND**:
- Before: 5K-15K → After: 5K-15K (▼-4912)
- **AIME2025**:
- Before: 20K-35K → After: 20K-35K (▼-6179)
- **MMLUPro**:
- Before: 1K-4K → After: 1K-4K (▼-817)
- **LiveCodeBenchV6**:
- Before: 20K-30K → After: 20K-30K (▼-745)
- **Overall**:
- Before: 15K-25K → After: 15K-25K (▼-4791)
---
### Key Observations
1. **Performance Trends**:
- Most benchmarks (5/7) improved post-toggle, with `LiveCodeBenchV6` showing the largest gain (+2.2%).
- `MMLUPro` and `GPQADIAMOND` experienced degradation (-2.0% and -1.0%, respectively).
- Overall performance increased slightly (+0.3%).
2. **Token Usage Trends**:
- All benchmarks showed reductions post-toggle, with `AIME2025` having the largest decrease (-6179).
- No benchmarks saw increased token usage.
- Overall token usage decreased by 4791.
3. **Color Consistency**:
- Legends match data point colors: gray squares (pre-toggle) and colored circles (post-toggle) align spatially with their respective axes.
---
### Interpretation
The toggle appears to have **optimized performance** and **reduced token consumption** across most benchmarks. While the majority of metrics improved, two performance benchmarks (`MMLUPro` and `GPQADIAMOND`) degraded, suggesting potential trade-offs in specific use cases. The consistent reduction in token usage across all benchmarks indicates a successful efficiency gain, likely due to algorithmic optimizations or resource management changes. The "Overall" metrics reinforce this, showing a net positive impact on both performance and token efficiency. The absence of increased token usage post-toggle suggests the toggle did not introduce unintended overhead.