## Line Chart: Processing Time vs. ID Batch Size with Varying Feedback Frequencies
### Overview
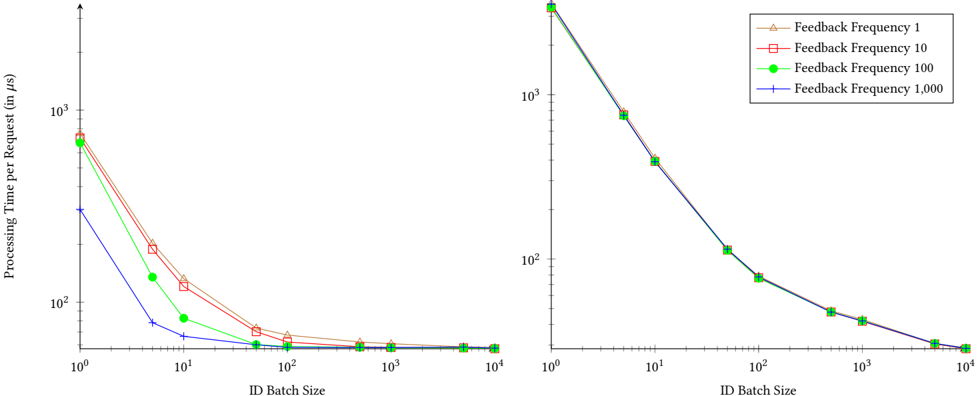
The image contains two line charts placed side-by-side, both depicting the relationship between "ID Batch Size" (x-axis) and "Processing Time per Request (in μs)" (y-axis) for different "Feedback Frequencies." Both axes use a logarithmic scale. The charts show how processing time decreases as the ID Batch Size increases, with different feedback frequencies influencing the rate of decrease.
### Components/Axes
* **X-Axis (ID Batch Size):** Logarithmic scale ranging from 10<sup>0</sup> (1) to 10<sup>4</sup> (10,000).
* **Y-Axis (Processing Time per Request (in μs)):** Logarithmic scale ranging from 10<sup>1</sup> (10) to 10<sup>3</sup> (1,000).
* **Legend (Top-Right):**
* Tan line with triangle markers: Feedback Frequency 1
* Red line with square markers: Feedback Frequency 10
* Green line with circle markers: Feedback Frequency 100
* Blue line with plus markers: Feedback Frequency 1,000
### Detailed Analysis
**Chart 1 (Left):**
* **Feedback Frequency 1 (Tan, Triangle):** The line starts at approximately 600 μs at a batch size of 1, then decreases to approximately 50 μs at a batch size of 100, and further decreases to approximately 25 μs at a batch size of 10,000.
* **Feedback Frequency 10 (Red, Square):** The line starts at approximately 600 μs at a batch size of 1, then decreases to approximately 60 μs at a batch size of 100, and further decreases to approximately 25 μs at a batch size of 10,000.
* **Feedback Frequency 100 (Green, Circle):** The line starts at approximately 600 μs at a batch size of 1, then decreases to approximately 40 μs at a batch size of 100, and further decreases to approximately 25 μs at a batch size of 10,000.
* **Feedback Frequency 1,000 (Blue, Plus):** The line starts at approximately 200 μs at a batch size of 1, then decreases to approximately 30 μs at a batch size of 10, and further decreases to approximately 25 μs at a batch size of 10,000.
**Chart 2 (Right):**
* **Feedback Frequency 1 (Tan, Triangle):** The line starts at approximately 1,700 μs at a batch size of 1, then decreases to approximately 70 μs at a batch size of 100, and further decreases to approximately 25 μs at a batch size of 10,000.
* **Feedback Frequency 10 (Red, Square):** The line starts at approximately 1,700 μs at a batch size of 1, then decreases to approximately 70 μs at a batch size of 100, and further decreases to approximately 25 μs at a batch size of 10,000.
* **Feedback Frequency 100 (Green, Circle):** The line starts at approximately 1,700 μs at a batch size of 1, then decreases to approximately 70 μs at a batch size of 100, and further decreases to approximately 25 μs at a batch size of 10,000.
* **Feedback Frequency 1,000 (Blue, Plus):** The line starts at approximately 1,700 μs at a batch size of 1, then decreases to approximately 70 μs at a batch size of 100, and further decreases to approximately 25 μs at a batch size of 10,000.
### Key Observations
* All lines show a decreasing trend: as the ID Batch Size increases, the Processing Time per Request decreases.
* The lines converge at higher ID Batch Sizes (around 10,000), indicating that the impact of Feedback Frequency diminishes as the batch size increases.
* In the left chart, the Feedback Frequency of 1,000 has the lowest processing time at a batch size of 1.
* In the right chart, the Feedback Frequency of 1, 10, 100, and 1,000 have the same processing time at a batch size of 1.
### Interpretation
The charts demonstrate the relationship between ID Batch Size, Processing Time, and Feedback Frequency. Increasing the ID Batch Size generally reduces the processing time per request, likely due to amortizing overhead costs over a larger batch. The Feedback Frequency also plays a role, particularly at smaller batch sizes. Higher feedback frequencies (1,000) initially result in lower processing times in the left chart, suggesting that more frequent feedback can optimize performance. However, as the batch size increases, the impact of feedback frequency diminishes, and all configurations converge to similar processing times. The right chart shows that the Feedback Frequency has no impact on the processing time at a batch size of 1. This suggests that the Feedback Frequency is only effective when the batch size is greater than 1.