\n
## Chart: Processing Time per Request vs. ID Batch Size
### Overview
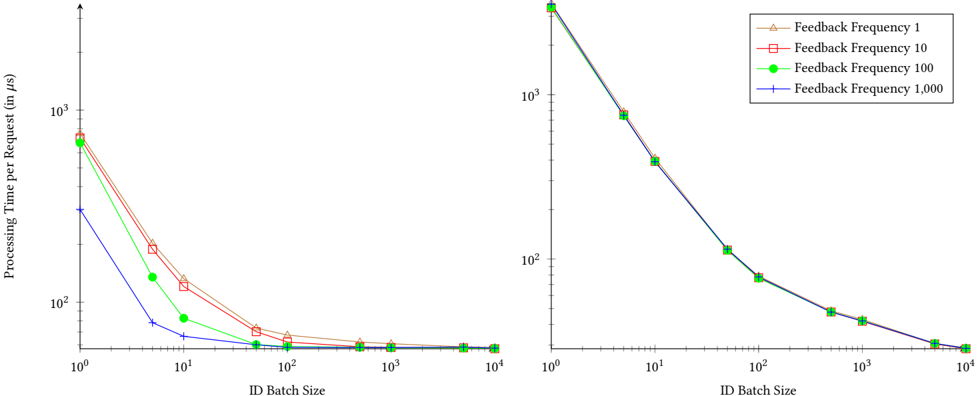
The image presents a line chart comparing the processing time per request (in microseconds, µs) against the ID batch size. The chart displays four different lines, each representing a different feedback frequency. The x-axis represents the ID Batch Size on a logarithmic scale, while the y-axis represents the Processing Time per Request, also on a logarithmic scale.
### Components/Axes
* **X-axis:** ID Batch Size (Logarithmic scale from 10⁰ to 10⁴)
* **Y-axis:** Processing Time per Request (in µs) (Logarithmic scale from 10⁰ to 10³)
* **Legend:** Located in the top-right corner.
* Feedback Frequency 1 (represented by a triangle marker and a reddish-orange line)
* Feedback Frequency 10 (represented by a square marker and a reddish line)
* Feedback Frequency 100 (represented by a circle marker and a green line)
* Feedback Frequency 1,000 (represented by a plus marker and a blue line)
### Detailed Analysis
The chart consists of four lines, each representing a different feedback frequency.
* **Feedback Frequency 1 (Reddish-Orange):** This line starts at approximately 10³ µs at an ID Batch Size of 10⁰. It rapidly decreases, reaching approximately 10¹ µs at an ID Batch Size of 10¹, then continues to decrease to approximately 10⁰ µs at an ID Batch Size of 10². After that, the line plateaus, remaining relatively constant around 10⁰ µs for ID Batch Sizes ranging from 10² to 10⁴.
* **Feedback Frequency 10 (Reddish):** This line begins at approximately 10³ µs at an ID Batch Size of 10⁰. It decreases more slowly than the Feedback Frequency 1 line, reaching approximately 10² µs at an ID Batch Size of 10¹, and then continues to decrease to approximately 10¹ µs at an ID Batch Size of 10². It then plateaus, remaining relatively constant around 10¹ µs for ID Batch Sizes ranging from 10² to 10⁴.
* **Feedback Frequency 100 (Green):** This line starts at approximately 10³ µs at an ID Batch Size of 10⁰. It decreases rapidly, reaching approximately 10¹ µs at an ID Batch Size of 10¹, and then continues to decrease to approximately 10⁰ µs at an ID Batch Size of 10². It then plateaus, remaining relatively constant around 10⁰ µs for ID Batch Sizes ranging from 10² to 10⁴.
* **Feedback Frequency 1,000 (Blue):** This line begins at approximately 10³ µs at an ID Batch Size of 10⁰. It decreases very rapidly, reaching approximately 10² µs at an ID Batch Size of 10¹, and then continues to decrease to approximately 10¹ µs at an ID Batch Size of 10². It then plateaus, remaining relatively constant around 10¹ µs for ID Batch Sizes ranging from 10² to 10⁴.
All lines exhibit a steep decline in processing time as the ID Batch Size increases from 10⁰ to 10². Beyond an ID Batch Size of 10², the processing time stabilizes for all feedback frequencies.
### Key Observations
* Higher feedback frequencies generally result in lower processing times, especially for smaller ID Batch Sizes.
* The benefit of increasing the feedback frequency diminishes as the ID Batch Size increases.
* For larger ID Batch Sizes (above 10²), the processing time converges for all feedback frequencies.
* The logarithmic scales on both axes emphasize the significant reduction in processing time achieved with increasing ID Batch Size.
### Interpretation
The data suggests that increasing the ID Batch Size significantly reduces processing time per request. This is likely due to the amortization of overhead costs across multiple requests. The feedback frequency also plays a role, with higher frequencies generally leading to lower processing times, particularly when the ID Batch Size is small. However, the impact of feedback frequency diminishes as the ID Batch Size increases, indicating that the benefits of frequent feedback are less pronounced when processing larger batches of IDs.
The convergence of processing times for all feedback frequencies at larger ID Batch Sizes suggests that there is a point of diminishing returns for increasing the feedback frequency. Beyond this point, the overhead associated with providing feedback outweighs the benefits. This information is valuable for optimizing system performance by balancing the trade-offs between feedback frequency and ID Batch Size. The logarithmic scales indicate that the initial gains from increasing the ID Batch Size are substantial, but the rate of improvement decreases as the Batch Size grows.