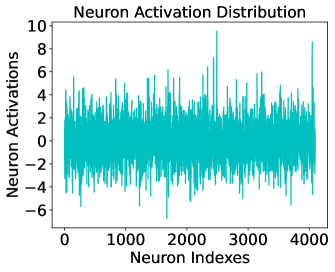
## Chart: Neuron Activation Distribution
### Overview
The image is a line chart showing the distribution of neuron activations across a range of neuron indexes. The chart displays the activation level of each neuron, providing a visual representation of the neural network's activity.
### Components/Axes
* **Title:** Neuron Activation Distribution
* **X-axis:** Neuron Indexes
* Scale: 0 to 4000, with markers at 0, 1000, 2000, 3000, and 4000.
* **Y-axis:** Neuron Activations
* Scale: -6 to 10, with markers at -6, -4, -2, 0, 2, 4, 6, 8, and 10.
* **Data Series:** A single line in teal color representing the neuron activation levels.
### Detailed Analysis
The teal line represents the activation level for each neuron index. The line fluctuates significantly, indicating varying levels of activation across the neurons.
* **General Trend:** The line oscillates around the 0 level, with most activations falling between -4 and 6.
* **Peaks:** There are a few noticeable peaks where the activation level spikes significantly.
* Around index 2500, there is a peak reaching approximately 9.
* Near index 4000, there is another peak reaching approximately 8.
* **Valleys:** There are also valleys where the activation level dips significantly.
* Around index 1000, there is a valley reaching approximately -5.
### Key Observations
* The majority of neurons have activation levels close to zero, suggesting a sparse activation pattern.
* The presence of peaks indicates that some neurons are highly active, potentially playing a crucial role in the network's function.
* The valleys indicate that some neurons are strongly inhibited.
### Interpretation
The chart provides insights into the activity of a neural network layer. The distribution of neuron activations suggests that the network employs a sparse activation strategy, where only a subset of neurons are highly active at any given time. The peaks and valleys highlight specific neurons that are either strongly activated or inhibited, potentially indicating their importance in processing information. The overall distribution can be used to assess the health and performance of the neural network, and to identify potential issues such as dead neurons or runaway activations.