## Chart Type: Line Plot - Neuron Activation Distribution
### Overview
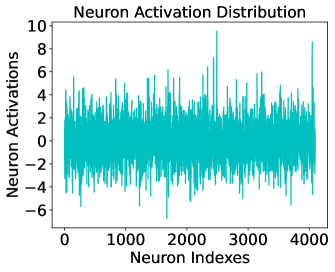
This image is a technical line chart titled **"Neuron Activation Distribution"**. It visualizes the activation levels (output values) of a series of neurons, likely from a specific layer within a neural network. The data is represented by a single, highly volatile cyan-colored line plotted against neuron indices.
### Components/Axes
* **Header (Top-Center):** Title text "Neuron Activation Distribution".
* **Y-Axis (Left):**
* **Label:** "Neuron Activations"
* **Scale:** Ranges from -8 to 10.
* **Major Markers:** -6, -4, -2, 0, 2, 4, 6, 8, 10.
* **X-Axis (Bottom):**
* **Label:** "Neuron Indexes"
* **Scale:** Ranges from 0 to approximately 4100.
* **Major Markers:** 0, 1000, 2000, 3000, 4000.
* **Legend:** No explicit legend is present as there is only one data series.
* **Data Series:** A single continuous line in a cyan/teal color (#00CED1 approx.).
### Detailed Analysis
The chart displays a high-frequency signal that oscillates rapidly around a central baseline.
* **Spatial Grounding:** The plot area is bounded by a black rectangular frame. The labels are positioned externally to the left and bottom.
* **Trend Verification:** The data series does not exhibit a global upward or downward trend. Instead, it shows a **stationary stochastic pattern** centered near zero. The "density" of the line indicates a very high number of data points (one for each index).
* **Numerical Estimates:**
* **Baseline/Mean:** The activations are centered around **0**.
* **Typical Range:** The majority of neuron activations fall within the **[-4, +4]** range.
* **Maximum Positive Peak:** A significant outlier occurs near **Neuron Index 2500**, reaching a value of approximately **+9.5**.
* **Maximum Negative Peak:** A significant downward spike occurs near **Neuron Index 1700**, reaching approximately **-6.5**.
* **Data Volume:** Given the x-axis ends slightly past 4000, it is highly probable there are **4096** neurons represented (a standard power-of-two layer size in deep learning).
### Key Observations
* **Zero-Centering:** The distribution is well-balanced around zero, which is often a goal in neural network training to prevent vanishing or exploding gradients.
* **Sparsity/Outliers:** While most neurons have low-magnitude activations, a small subset of neurons (the sharp spikes) are "highly active" or "highly inhibited" for the given input.
* **Noise-like Appearance:** The lack of a smooth curve suggests that adjacent neurons in this index ordering do not necessarily share similar activation levels, which is typical for flattened dense layers.
### Interpretation
* **Model State:** This plot likely represents a "snapshot" of a hidden layer's state (e.g., a FC/Dense layer or the output of a Transformer block) during a forward pass.
* **Normalization:** The fact that the values are largely constrained between -6 and 6 suggests the use of normalization techniques like **Batch Normalization** or **Layer Normalization**, or perhaps a specific initialization scheme (like Xavier or He initialization).
* **Feature Detection:** The extreme spikes (outliers) represent specific neurons that have "fired" strongly. In a technical context, these neurons have detected features in the input data that they were specifically trained to recognize.
* **Architecture Hint:** The index count of ~4096 strongly suggests this is a visualization from a large-scale model, such as a VGG-16/19 fully connected layer or a hidden dimension in a modern Large Language Model (LLM).