\n
## Line Chart: Neuron Activation Distribution
### Overview
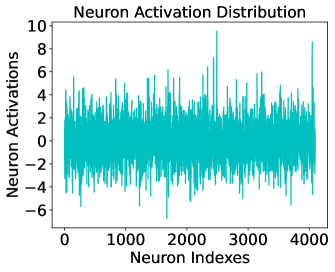
The image presents a line chart visualizing the distribution of neuron activations across neuron indices. The chart displays a fluctuating pattern of activation values, ranging from approximately -6 to +8, across a range of neuron indices from 0 to 4000.
### Components/Axes
* **Title:** "Neuron Activation Distribution" - positioned at the top-center of the chart.
* **X-axis:** "Neuron Indexes" - ranging from 0 to 4000, with tick marks at intervals of 1000.
* **Y-axis:** "Neuron Activations" - ranging from -6 to 10, with tick marks at intervals of 2.
* **Data Series:** A single teal-colored line representing the neuron activation values.
### Detailed Analysis
The line chart exhibits a highly variable pattern. The line fluctuates significantly above and below the zero activation level.
* **Trend:** The line generally oscillates around the zero activation level, with no clear upward or downward trend across the entire range of neuron indices. There are periods of sustained positive activation, as well as periods of sustained negative activation.
* **Data Points (Approximate):**
* At Neuron Index 0, the activation is approximately +3.
* At Neuron Index 500, the activation is approximately +1.
* At Neuron Index 1000, the activation is approximately -2.
* At Neuron Index 1500, the activation is approximately +4.
* At Neuron Index 2000, the activation is approximately +6.
* At Neuron Index 2500, the activation is approximately +8.
* At Neuron Index 3000, the activation is approximately +2.
* At Neuron Index 3500, the activation is approximately -3.
* At Neuron Index 4000, the activation is approximately +5.
* **Range:** The activation values range from approximately -6 to +8.
* **Amplitude:** The amplitude of the fluctuations varies, with some peaks reaching nearly +8 and some troughs falling to approximately -6.
### Key Observations
* The distribution of neuron activations appears to be centered around zero, but with significant variability.
* There are no obvious patterns or correlations between neuron index and activation value.
* The activation values are not uniformly distributed; there are clusters of high and low activation values.
* The peak activation around Neuron Index 2500 is notably higher than other peaks.
### Interpretation
The chart suggests that the neurons in this layer are not consistently activated or inhibited. The wide range of activation values indicates that different neurons respond differently to the input. The lack of a clear trend suggests that there is no systematic relationship between neuron index and activation level. The high variability in activation values could be indicative of a complex neural network with diverse functions. The peak activation at Neuron Index 2500 might represent a particularly important neuron or a specific feature being detected by the network. Further analysis would be needed to determine the significance of this peak. The data suggests a relatively random distribution of neuron activations, which is common in neural networks during processing.