## Line Graph: Neuron Activation Distribution
### Overview
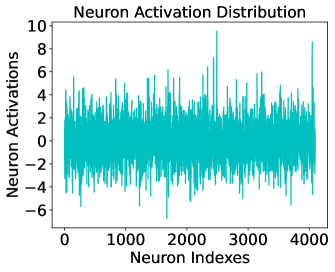
The image depicts a line graph titled "Neuron Activation Distribution," visualizing neuron activation values across neuron indexes. The graph shows a teal-colored line fluctuating vertically between approximately -6 and 8, with the x-axis representing neuron indexes (0 to 4000) and the y-axis representing neuron activation values (-10 to 10). The data exhibits irregular oscillations without a clear directional trend.
### Components/Axes
- **Title**: "Neuron Activation Distribution" (centered at the top).
- **X-axis**: Labeled "Neuron Indexes," scaled from 0 to 4000 in increments of 1000.
- **Y-axis**: Labeled "Neuron Activations," scaled from -10 to 10 in increments of 2.
- **Line**: A single teal-colored line representing neuron activation values. No legend is present to explain the line's meaning.
- **Gridlines**: Implied by the structured spacing of axis ticks, but not explicitly drawn.
### Detailed Analysis
- **Neuron Indexes (X-axis)**:
- Range: 0 to 4000 (4001 total points, assuming integer indexing).
- Key markers: 0, 1000, 2000, 3000, 4000.
- **Neuron Activations (Y-axis)**:
- Range: -10 to 10 (21 possible discrete values).
- Notable extremes: Peaks near 8 (e.g., ~3500) and troughs near -6 (e.g., ~2000).
- **Line Behavior**:
- Fluctuates irregularly, with no consistent upward or downward trend.
- Average activation hovers near 0, but with significant variability (±3–4 units).
- Sharp spikes and dips occur at irregular intervals (e.g., ~1500, ~2500, ~3500).
### Key Observations
1. **High Variability**: Activations deviate widely from the mean (0), suggesting diverse or noisy responses.
2. **Extreme Values**:
- Maximum activation: ~8 at neuron index ~3500.
- Minimum activation: ~-6 at neuron index ~2000.
3. **No Clear Pattern**: The line lacks periodicity or symmetry, indicating randomness or complex underlying dynamics.
4. **Spatial Distribution**: Peaks and troughs are distributed unevenly across the neuron index range.
### Interpretation
The graph likely represents the output of a neural network layer or biological neuron population under specific stimuli. The absence of a clear trend implies:
- **Noise or Complexity**: Activations may reflect stochastic processes, external perturbations, or high-dimensional interactions.
- **Potential Outliers**: Spikes at ~3500 and ~2000 could indicate critical neurons or anomalies in the dataset.
- **Biological/Technical Relevance**: In neuroscience, such variability might correlate with adaptive responses; in machine learning, it could signal overfitting or insufficient regularization.
No textual content, additional languages, or embedded diagrams are present. The graph focuses solely on quantitative neuron activation data.