## Bar Chart: Performance Speedup by Threshold
### Overview
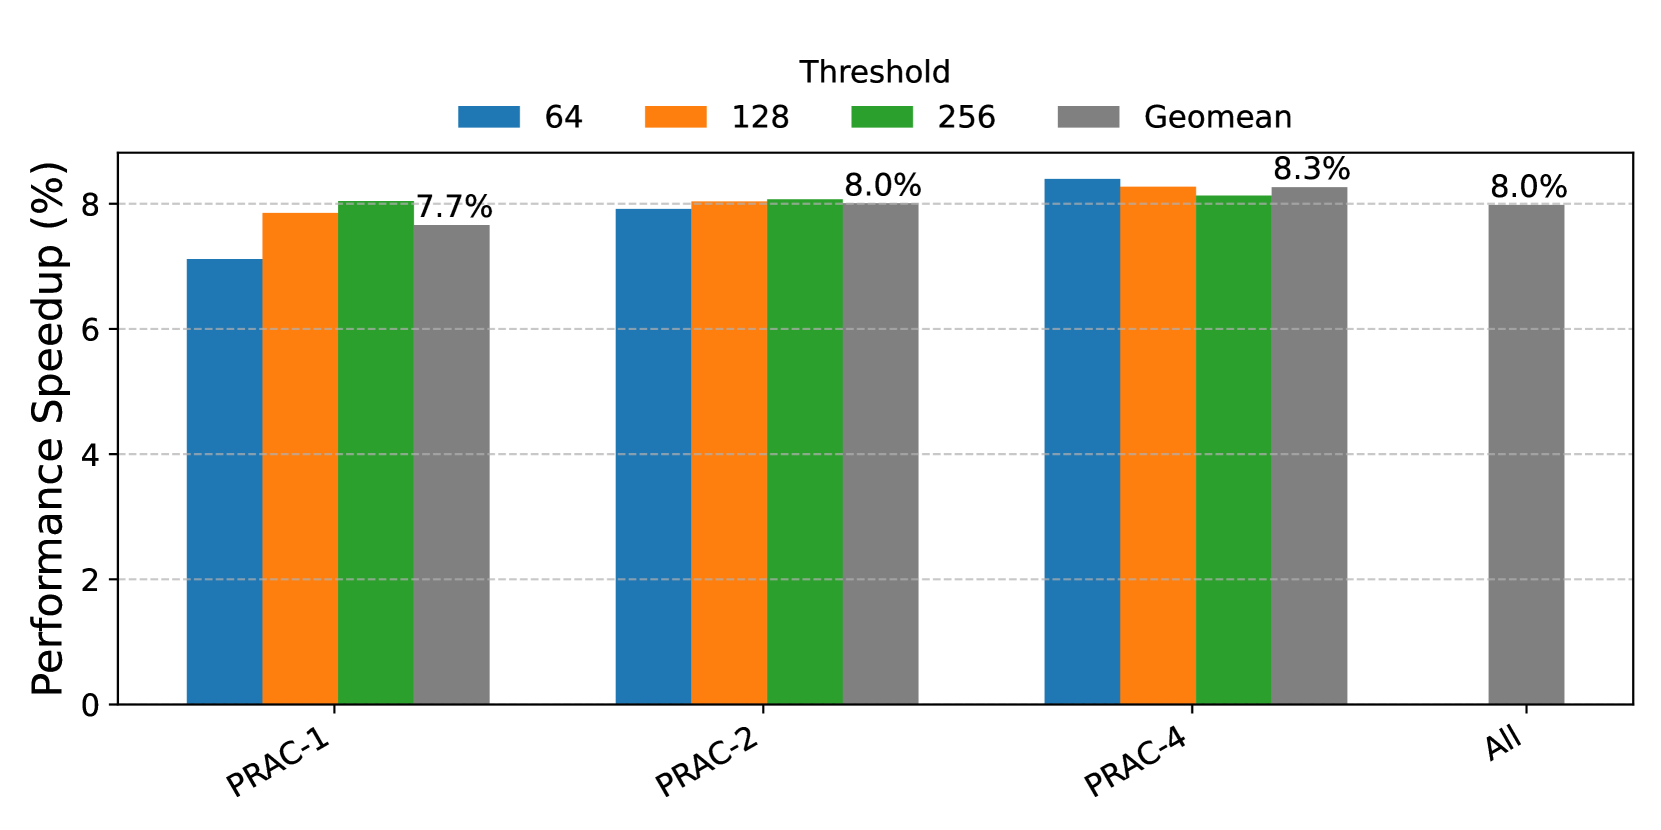
The image is a bar chart comparing the performance speedup (%) for different thresholds (64, 128, 256) across various configurations (PRAC-1, PRAC-2, PRAC-4, and All). The chart also includes a "Geomean" (geometric mean) for each configuration.
### Components/Axes
* **X-axis:** Categorical axis with labels "PRAC-1", "PRAC-2", "PRAC-4", and "All".
* **Y-axis:** Numerical axis labeled "Performance Speedup (%)", ranging from 0 to 8, with gridlines at intervals of 2.
* **Legend:** Located at the top of the chart, indicating the threshold values:
* Blue: 64
* Orange: 128
* Green: 256
* Gray: Geomean
### Detailed Analysis
Here's a breakdown of the performance speedup for each configuration and threshold:
* **PRAC-1:**
* 64 (Blue): Approximately 7.3%
* 128 (Orange): Approximately 7.9%
* 256 (Green): Approximately 8.0%
* Geomean (Gray): 7.7%
* **PRAC-2:**
* 64 (Blue): Approximately 7.9%
* 128 (Orange): Approximately 8.0%
* 256 (Green): Approximately 8.0%
* Geomean (Gray): 8.0%
* **PRAC-4:**
* 64 (Blue): Approximately 8.3%
* 128 (Orange): Approximately 8.2%
* 256 (Green): Approximately 8.1%
* Geomean (Gray): 8.3%
* **All:**
* Geomean (Gray): 8.0%
### Key Observations
* The performance speedup is generally consistent across different thresholds for each configuration.
* PRAC-4 shows the highest performance speedup overall.
* The "All" configuration only displays the Geomean.
### Interpretation
The chart suggests that the performance speedup is relatively stable across different threshold values (64, 128, 256) for each configuration (PRAC-1, PRAC-2, PRAC-4). The geometric mean provides a single representative value for each configuration, allowing for easy comparison. PRAC-4 appears to offer the best performance speedup compared to the other configurations. The "All" configuration likely represents an aggregate or average across all PRAC configurations, and its Geomean value provides a benchmark for overall performance.