## Line Graph: Loss vs. Pondering Steps
### Overview
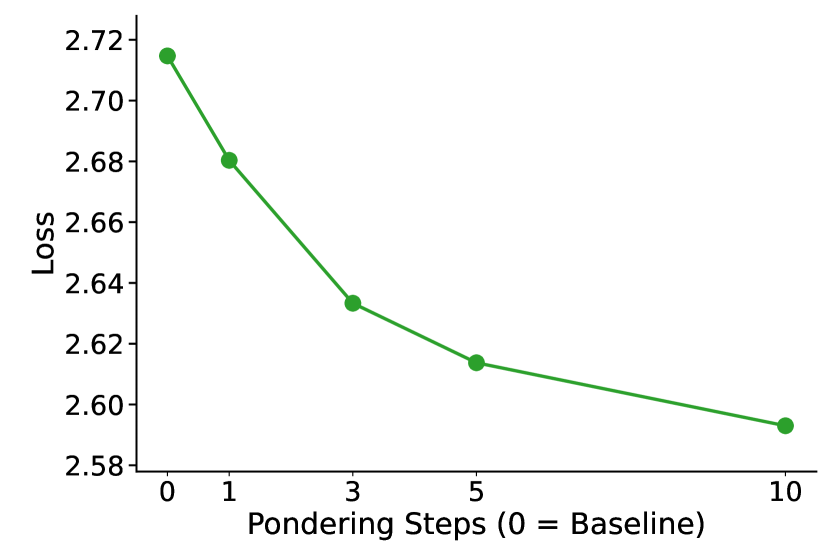
The image depicts a line graph illustrating the relationship between "Pondering Steps" (x-axis) and "Loss" (y-axis). The graph shows a downward trend in loss as the number of pondering steps increases, starting from a baseline of 0 steps.
### Components/Axes
- **X-axis (Horizontal)**:
- Label: "Pondering Steps (0 = Baseline)"
- Scale: 0 to 10, with ticks at 0, 1, 3, 5, and 10.
- Units: Discrete steps (no explicit units provided).
- **Y-axis (Vertical)**:
- Label: "Loss"
- Scale: 2.58 to 2.72, with ticks at 2.58, 2.60, 2.62, 2.64, 2.66, 2.68, 2.70, 2.72.
- Units: Numerical values (likely a metric like error or cost).
- **Legend**: Not visible in the image.
- **Line and Data Points**:
- A single green line connects five data points.
- Data points are marked with green dots.
### Detailed Analysis
- **Data Points**:
- (0, 2.71): Baseline loss at 0 steps.
- (1, 2.68): Loss decreases by 0.03 after 1 step.
- (3, 2.63): Loss decreases by 0.05 after 3 steps.
- (5, 2.61): Loss decreases by 0.02 after 5 steps.
- (10, 2.59): Loss decreases by 0.02 after 10 steps.
- **Trend**:
- The line slopes downward consistently from left to right, indicating a negative correlation between pondering steps and loss.
- The rate of decrease slows over time (e.g., 0.03 drop between 0–1 steps vs. 0.02 drops between 5–10 steps).
### Key Observations
1. **Steady Decline**: Loss decreases monotonically as pondering steps increase.
2. **Diminishing Returns**: The rate of loss reduction slows after the first few steps.
3. **Baseline Significance**: The highest loss (2.71) occurs at 0 steps, suggesting the baseline is suboptimal.
### Interpretation
The graph demonstrates that increasing the number of pondering steps reduces loss, implying that deeper analysis or reflection improves outcomes. The baseline (0 steps) represents the worst performance, while the trend suggests that even small increments in pondering steps yield measurable improvements. The diminishing returns after 5 steps may indicate a saturation point or diminishing marginal utility of additional steps. This could inform strategies for optimizing decision-making processes or resource allocation in scenarios requiring iterative analysis.
**Note**: No legend is present, but the green line and data points are consistent in color. All axis labels and data points are explicitly extracted from the image.