## Line Chart: Loss vs. Pondering Steps
### Overview
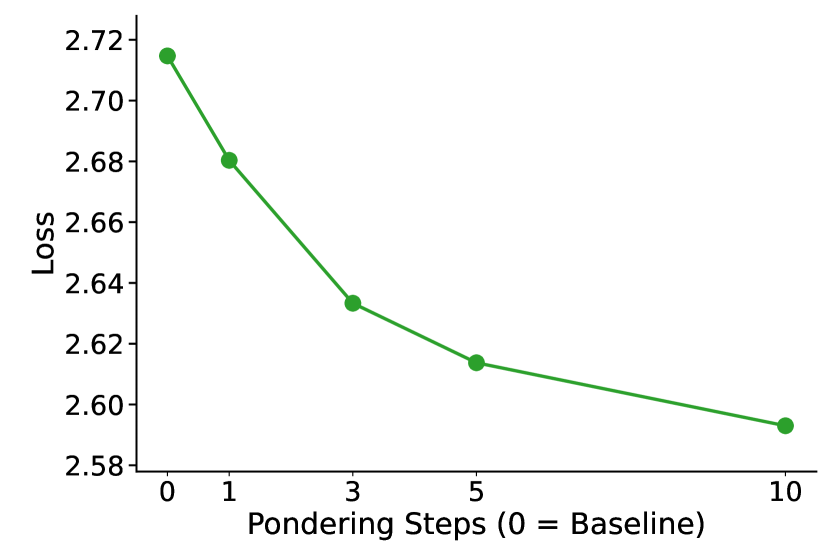
The image displays a line chart plotting a metric called "Loss" against "Pondering Steps." The chart demonstrates a clear inverse relationship: as the number of pondering steps increases, the loss value decreases. The data is presented as a single series connected by a green line with circular markers at each data point.
### Components/Axes
* **Y-Axis (Vertical):**
* **Label:** "Loss"
* **Scale:** Linear scale ranging from approximately 2.58 to 2.72.
* **Major Tick Marks:** 2.58, 2.60, 2.62, 2.64, 2.66, 2.68, 2.70, 2.72.
* **X-Axis (Horizontal):**
* **Label:** "Pondering Steps (0 = Baseline)"
* **Scale:** Discrete, non-linear scale with markers at specific step values.
* **Data Point Labels (X-values):** 0, 1, 3, 5, 10.
* **Data Series:**
* **Visual Representation:** A solid green line connecting filled green circular markers.
* **Legend:** No separate legend is present; the single series is defined by the axis labels.
### Detailed Analysis
The chart plots five distinct data points. The trend is consistently downward, indicating that loss decreases with more pondering steps. The rate of decrease is not constant; it is steepest initially and gradually flattens.
**Data Point Extraction (Approximate Values):**
| Pondering Steps | Loss (Approx.) |
| :-------------- | :------------- |
| 0 (Baseline) | 2.715 |
| 1 | 2.680 |
| 3 | 2.635 |
| 5 | 2.615 |
| 10 | 2.595 |
**Trend Verification:**
* The green line slopes downward from left to right across the entire chart.
* The slope is steepest between steps 0 and 1 (a drop of ~0.035).
* The slope becomes progressively less steep between subsequent points:
* From step 1 to 3: drop of ~0.045 over 2 steps.
* From step 3 to 5: drop of ~0.020 over 2 steps.
* From step 5 to 10: drop of ~0.020 over 5 steps.
### Key Observations
1. **Monotonic Decrease:** The loss value decreases at every measured increment of pondering steps. There are no increases or plateaus in the plotted data.
2. **Diminishing Returns:** The most significant reduction in loss occurs with the first pondering step. Each subsequent increase in steps yields a smaller absolute reduction in loss. The curve appears to be approaching an asymptote.
3. **Baseline Performance:** The "0 = Baseline" condition has the highest loss, establishing it as the reference point for improvement.
4. **Non-Linear X-Axis:** The x-axis does not have a uniform scale. The physical distance between 0 and 1 is similar to that between 1 and 3, despite representing different numerical intervals. This emphasizes the discrete nature of the tested step values.
### Interpretation
This chart likely visualizes the performance of a machine learning or computational model that employs an iterative "pondering" or reasoning process. The "Loss" is a standard metric where lower values indicate better performance (e.g., prediction error, cost function value).
The data suggests a strong positive effect of introducing a pondering mechanism: moving from the baseline (0 steps) to just 1 step provides a substantial performance boost. However, the principle of diminishing returns is clearly in effect. While increasing the computational budget (more steps) continues to improve performance, the marginal benefit per additional step decreases significantly. This presents a classic trade-off between computational cost (time/resources for more steps) and performance gain. The optimal number of steps would depend on the specific constraints and requirements of the application, balancing the need for low loss against the cost of additional computation. The chart provides the empirical data necessary to make that cost-benefit analysis.