## Scatter Plot: Malicious vs. Safe Data Points
### Overview
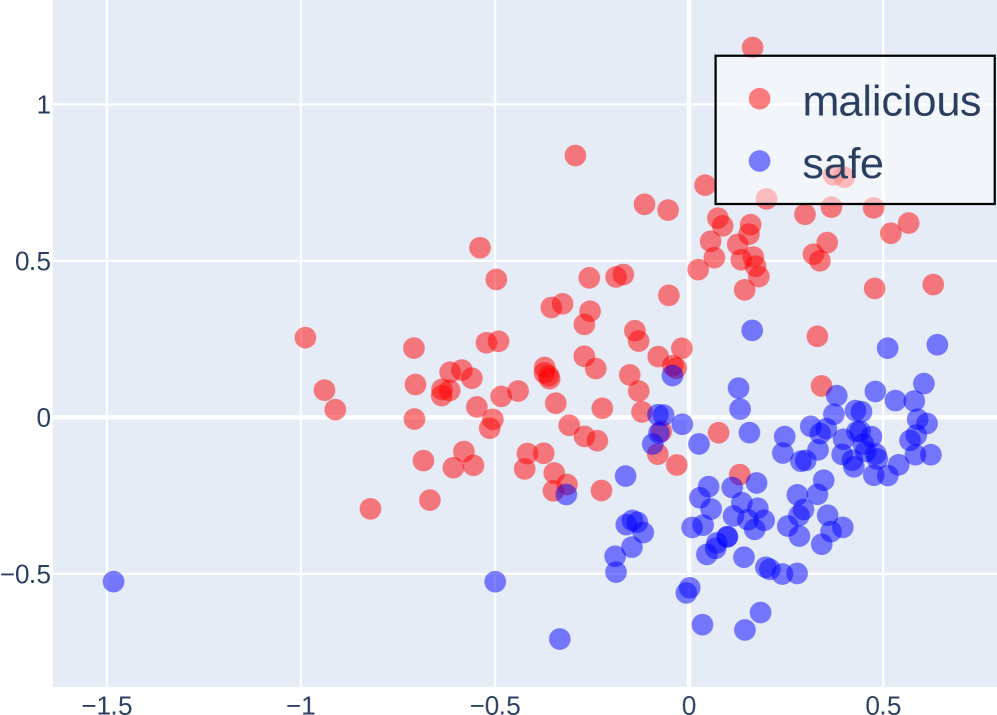
The image is a scatter plot displaying two categories of data points: "malicious" and "safe." The plot shows the distribution of these points across a two-dimensional space, with no explicit labels on the x and y axes. The "malicious" data points are represented in red, while the "safe" data points are in blue. There appears to be some clustering of the "safe" data points towards the right side and lower half of the plot, while the "malicious" data points are more dispersed, with a tendency towards the upper-right quadrant.
### Components/Axes
* **X-axis:** Ranges from approximately -1.5 to 0.5, with gridlines at -1, -0.5, 0, and 0.5. No label is provided.
* **Y-axis:** Ranges from approximately -0.5 to 1, with gridlines at -0.5, 0, 0.5, and 1. No label is provided.
* **Legend:** Located in the top-right corner, enclosed in a black rectangle.
* Red circle: "malicious"
* Blue circle: "safe"
### Detailed Analysis
* **Malicious (Red) Data Points:**
* Trend: The red data points are scattered across the plot, with a higher concentration in the upper-right quadrant.
* Distribution: The red points are more spread out compared to the blue points.
* Approximate Range: X values range from -1 to 0.5, and Y values range from 0 to 1.
* **Safe (Blue) Data Points:**
* Trend: The blue data points are clustered towards the right side and lower half of the plot.
* Distribution: The blue points are more tightly grouped compared to the red points.
* Approximate Range: X values range from -1.5 to 0.5, and Y values range from -0.5 to 0.2.
### Key Observations
* There is a clear separation between the "malicious" and "safe" data points, with the "safe" points tending to cluster in the lower-right quadrant and the "malicious" points being more dispersed.
* There is some overlap between the two categories, particularly in the region around x=0 and y=0.
* The plot suggests that the two dimensions represented by the x and y axes are useful in distinguishing between "malicious" and "safe" data points.
### Interpretation
The scatter plot visualizes the distribution of "malicious" and "safe" data points in a two-dimensional space. The clustering of "safe" data points and the dispersion of "malicious" data points suggest that the features represented by the x and y axes are informative in classifying data as either "malicious" or "safe." The overlap between the two categories indicates that the separation is not perfect, and there may be some ambiguity in classifying certain data points. The plot could represent the output of a dimensionality reduction technique (e.g., PCA, t-SNE) applied to a dataset of malicious and safe samples, where the x and y axes represent the two most important components that capture the variance in the data.