\n
## Scatter Plot: Malicious vs. Safe Data Points
### Overview
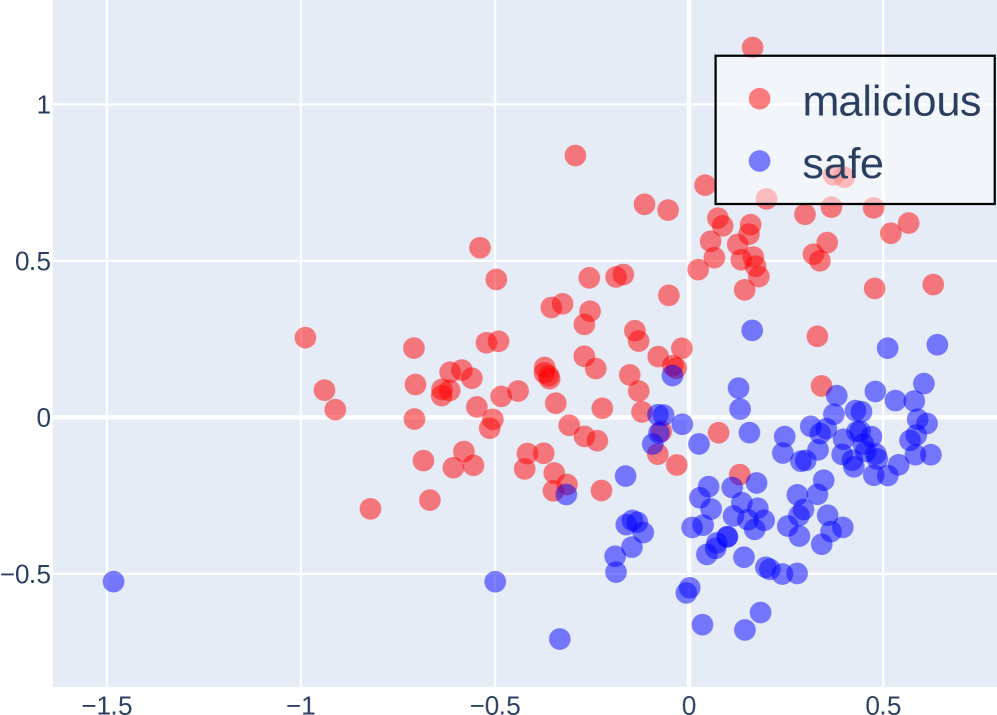
This image presents a scatter plot visualizing the distribution of data points categorized as either "malicious" or "safe" across two dimensions. The plot appears to be attempting to classify data based on these two features.
### Components/Axes
* **X-axis:** Ranges approximately from -1.5 to 0.5. No explicit label is provided.
* **Y-axis:** Ranges approximately from -0.5 to 1.0. No explicit label is provided.
* **Legend:** Located in the top-right corner.
* **malicious:** Represented by red circles.
* **safe:** Represented by blue circles.
### Detailed Analysis
The scatter plot displays a clear separation between the "malicious" and "safe" data points.
* **Malicious (Red):** The malicious data points are concentrated in the region where the X-axis value is less than 0, and the Y-axis value is greater than 0. The points are scattered, but generally cluster between approximately X = -1.2 and X = 0.2, and Y = 0 and Y = 0.8. There is a slight upward trend as the X-value increases.
* **Safe (Blue):** The safe data points are concentrated in the region where the X-axis value is greater than -0.7, and the Y-axis value is less than 0.3. The points are also scattered, but generally cluster between approximately X = -0.7 and X = 0.5, and Y = -0.5 and Y = 0.3. There is a slight upward trend as the X-value increases.
It's difficult to provide precise numerical values for each point without access to the underlying data. However, we can estimate some representative values:
* **Malicious:**
* (-1.0, 0.6)
* (-0.5, 0.3)
* (0.0, 0.7)
* **Safe:**
* (-0.5, -0.2)
* (0.0, 0.0)
* (0.3, -0.1)
### Key Observations
* There is a strong visual separation between the "malicious" and "safe" data points.
* The majority of "malicious" points have positive Y-axis values, while the majority of "safe" points have negative Y-axis values.
* There are a few outliers: a single "safe" point at approximately (-1.5, -0.5) and a few "malicious" points with negative Y-axis values.
* The distribution of points is not uniform within each category.
### Interpretation
The data suggests that the two dimensions represented by the X and Y axes are effective in distinguishing between "malicious" and "safe" data. The clear separation indicates that a classification model based on these features would likely achieve high accuracy. The outliers suggest that the features are not perfect predictors, and some misclassifications may occur.
The upward trend within each category could indicate a correlation between the two dimensions and the classification. Further investigation would be needed to determine the nature of this correlation and whether it is statistically significant.
Without knowing what the X and Y axes represent, it's difficult to provide a more specific interpretation. However, the plot suggests that these features capture important characteristics that differentiate between malicious and safe data. This could be used for anomaly detection, fraud prevention, or security analysis.