## Diagram: Instruction Sequence and DAG Representation
### Overview
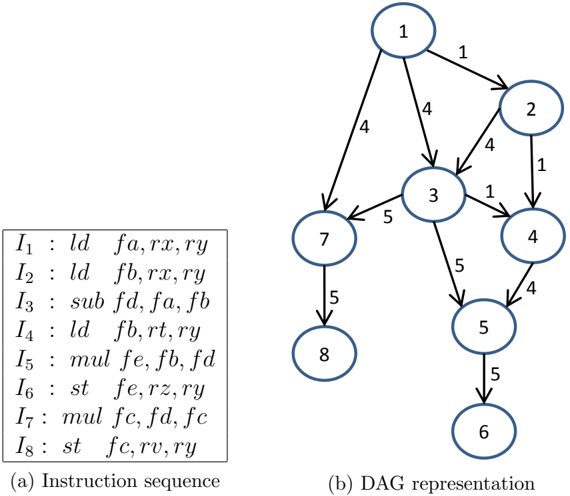
The image presents a comparison between an instruction sequence and its corresponding Directed Acyclic Graph (DAG) representation. The instruction sequence is a list of assembly-like instructions, while the DAG visually represents the dependencies between these instructions.
### Components/Axes
* **(a) Instruction sequence:** A list of instructions, each labeled I1 through I8.
* **(b) DAG representation:** A directed graph where nodes represent instructions and edges represent dependencies.
* **Nodes:** Each node is a circle containing a number (1-8), representing an instruction from the instruction sequence.
* **Edges:** Arrows indicate the flow of data or dependencies between instructions. Each edge is labeled with a number, presumably representing a cost or weight associated with the dependency.
### Detailed Analysis
**Instruction Sequence:**
The instruction sequence is as follows:
* I1: ld fa, rx, ry
* I2: ld fb, rx, ry
* I3: sub fd, fa, fb
* I4: ld fb, rt, ry
* I5: mul fe, fb, fd
* I6: st fe, rz, ry
* I7: mul fc, fd, fc
* I8: st fc, rv, ry
**DAG Representation:**
The DAG consists of 8 nodes, numbered 1 through 8, corresponding to the instructions in the sequence. The edges and their associated weights are as follows:
* Node 1 -> Node 2: Weight 1
* Node 1 -> Node 3: Weight 4
* Node 1 -> Node 7: Weight 4
* Node 2 -> Node 3: Weight 4
* Node 2 -> Node 4: Weight 1
* Node 3 -> Node 5: Weight 5
* Node 3 -> Node 7: Weight 5
* Node 4 -> Node 5: Weight 4
* Node 5 -> Node 6: Weight 5
* Node 7 -> Node 8: Weight 5
### Key Observations
* Instructions I1 and I2 (Nodes 1 and 2) both load data from memory and are independent of each other, as they have no direct dependency.
* Instruction I3 (Node 3) depends on the results of I1 and I2.
* Instruction I5 (Node 5) depends on the results of I3 and I4.
* Instructions I6 and I8 (Nodes 6 and 8) store data to memory and are the final nodes in their respective paths.
### Interpretation
The DAG representation visually illustrates the data dependencies between instructions in the sequence. This representation is useful for optimizing code execution, such as identifying opportunities for parallel execution or reordering instructions to minimize execution time. The edge weights could represent the cost of transferring data between instructions, which could be used to further optimize the execution schedule. The DAG highlights the critical paths in the instruction sequence, which are the paths with the highest cumulative edge weights. These paths represent the instructions that have the greatest impact on overall execution time.