\n
## Diagram: Instruction Sequence and Directed Acyclic Graph (DAG) Representation
### Overview
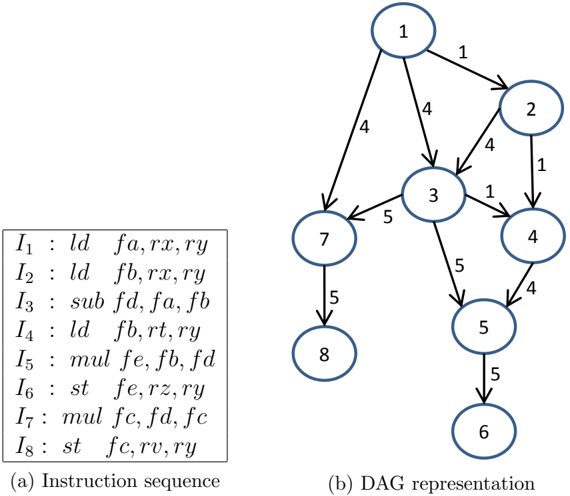
The image presents a comparison between an instruction sequence (a list of assembly-like instructions) and its corresponding Directed Acyclic Graph (DAG) representation. The instruction sequence is labeled "(a)", and the DAG is labeled "(b)". The DAG visually depicts the dependencies between the instructions.
### Components/Axes
The image consists of two main components:
1. **Instruction Sequence:** A vertically aligned list of eight instructions, labeled I1 through I8. Each instruction is formatted as "Instruction : operands".
2. **DAG Representation:** A graph composed of nodes (numbered 1 through 8) and directed edges representing dependencies.
### Content Details
**Instruction Sequence (a):**
* I1 : ld fa, rx, ry
* I2 : ld fb, rx, ry
* I3 : sub fd, fa, fb
* I4 : ld fb, rt, ry
* I5 : mul fe, fb, fd
* I6 : st fe, rz, ry
* I7 : mul fc, fd, fc
* I8 : st fc, rv, ry
**DAG Representation (b):**
The DAG consists of 8 nodes, numbered 1 to 8. The edges indicate dependencies.
* Node 1 has outgoing edges to nodes 2 and 3, with edge weights of 1 and 4 respectively.
* Node 2 has an outgoing edge to node 4 with a weight of 4.
* Node 3 has outgoing edges to nodes 4, 5, and 7 with weights of 1, 5, and 5 respectively.
* Node 4 has an outgoing edge to node 5 with a weight of 4.
* Node 5 has an outgoing edge to node 6 with a weight of 5.
* Node 7 has an outgoing edge to node 8 with a weight of 5.
* Node 8 has no outgoing edges.
The nodes represent the instructions, and the edges represent data dependencies. For example, the edge from node 1 to node 3 indicates that instruction I3 depends on the result of instruction I1.
### Key Observations
* The DAG visually demonstrates the order in which instructions can be executed, taking dependencies into account.
* Instructions I1 and I2 (ld fa, rx, ry and ld fb, rx, ry) can be executed in parallel as they are both sources.
* Instruction I8 (st fc, rv, ry) is the final instruction, as it has no outgoing edges.
* The edge weights represent the latency or cost associated with the dependency.
### Interpretation
The image illustrates the concept of instruction-level parallelism and how a DAG can be used to represent and optimize instruction scheduling. The DAG allows for identifying independent instructions that can be executed concurrently, potentially improving performance. The weights on the edges suggest that some dependencies are more costly (take longer) than others. The DAG representation is a common technique used in compilers and processors to optimize code execution. The diagram shows how a linear sequence of instructions can be transformed into a graph that reveals opportunities for parallel execution. The DAG is a visual tool for understanding data flow and dependencies within a program.