## Chart and Trajectory Plots: Point Robot 2D Navigation
### Overview
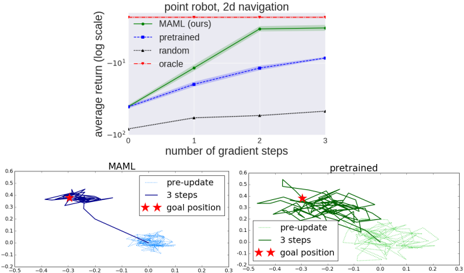
The image presents a combination of a line chart and two trajectory plots, all related to the performance of different learning algorithms for a point robot navigating in 2D. The line chart compares the average return (log scale) of four algorithms (MAML, pretrained, random, and oracle) over a number of gradient steps. The trajectory plots visualize the robot's movement during the "MAML" and "pretrained" algorithms, showing the path before and after updates, and indicating the goal position.
### Components/Axes
**Line Chart:**
* **Title:** point robot, 2d navigation
* **X-axis:** number of gradient steps (values: 0, 1, 2, 3)
* **Y-axis:** average return (log scale) (values range from -10<sup>2</sup> to -10<sup>1</sup>)
* **Legend:** Located in the top-right of the chart.
* MAML (ours): Solid green line with shaded region indicating uncertainty.
* pretrained: Dashed blue line with shaded region indicating uncertainty.
* random: Dotted black line.
* oracle: Dashed red line with plus markers.
**Trajectory Plots:**
* **Titles:** MAML (left), pretrained (right)
* **Axes:** Both plots have similar x and y axes, ranging approximately from -0.5 to 0.6.
* **Legend:** Located in the top-right of each plot.
* pre-update: Light blue (MAML) or light green (pretrained) line, showing the initial trajectory.
* 3 steps: Dark blue (MAML) or dark green (pretrained) line, showing the trajectory after 3 gradient steps.
* goal position: Red star marker.
### Detailed Analysis
**Line Chart Data:**
* **MAML (ours):** Solid green line. The average return starts around -10<sup>1</sup> at 0 gradient steps, increases to approximately 5 at 1 step, reaches approximately 30 at 2 steps, and plateaus at approximately 30 at 3 steps.
* **pretrained:** Dashed blue line. The average return starts around -10<sup>1</sup> at 0 gradient steps, increases to approximately 5 at 1 step, reaches approximately 10 at 2 steps, and plateaus at approximately 10 at 3 steps.
* **random:** Dotted black line. The average return remains relatively constant around -10<sup>2</sup> across all gradient steps.
* **oracle:** Dashed red line with plus markers. The average return remains constant at approximately 30 across all gradient steps.
**Trajectory Plots:**
* **MAML:** The "pre-update" trajectory (light blue) shows erratic movement. After 3 steps (dark blue), the trajectory converges towards the goal position (red star).
* **pretrained:** The "pre-update" trajectory (light green) shows erratic movement. After 3 steps (dark green), the trajectory converges towards the goal position (red star).
### Key Observations
* MAML and pretrained algorithms show significant improvement in average return with increasing gradient steps, while the random algorithm remains consistently low.
* The oracle algorithm provides a constant, high average return, serving as a benchmark.
* The trajectory plots indicate that both MAML and pretrained algorithms learn to navigate towards the goal position after a few gradient steps.
### Interpretation
The line chart demonstrates the effectiveness of meta-learning (MAML) and pretraining in improving the performance of a point robot's navigation task. The MAML algorithm appears to outperform the pretrained algorithm, achieving a higher average return after a few gradient steps. The random algorithm's consistently low performance highlights the importance of learning in this task. The oracle algorithm represents an ideal, potentially unattainable, performance level.
The trajectory plots visually confirm the learning process, showing how the robot's movement becomes more directed towards the goal position as the algorithms are updated. The initial erratic movements ("pre-update") are gradually replaced by more focused trajectories after 3 gradient steps.
The data suggests that MAML is a more effective learning algorithm for this specific task compared to pretraining. The comparison against a random strategy and an oracle provides context for the performance gains achieved by MAML and pretraining.