# Technical Document Extraction: Line Chart Analysis
## 1. Chart Type and Structure
- **Chart Type**: Line chart
- **Axes**:
- **X-axis**: `#Params (B)` (Parameter count in billions)
- **Y-axis**: `Inference Latency (s)` (Inference latency in seconds)
- **Legend**: Located on the right side of the chart, with color-coded labels for each data series.
## 2. Data Series and Labels
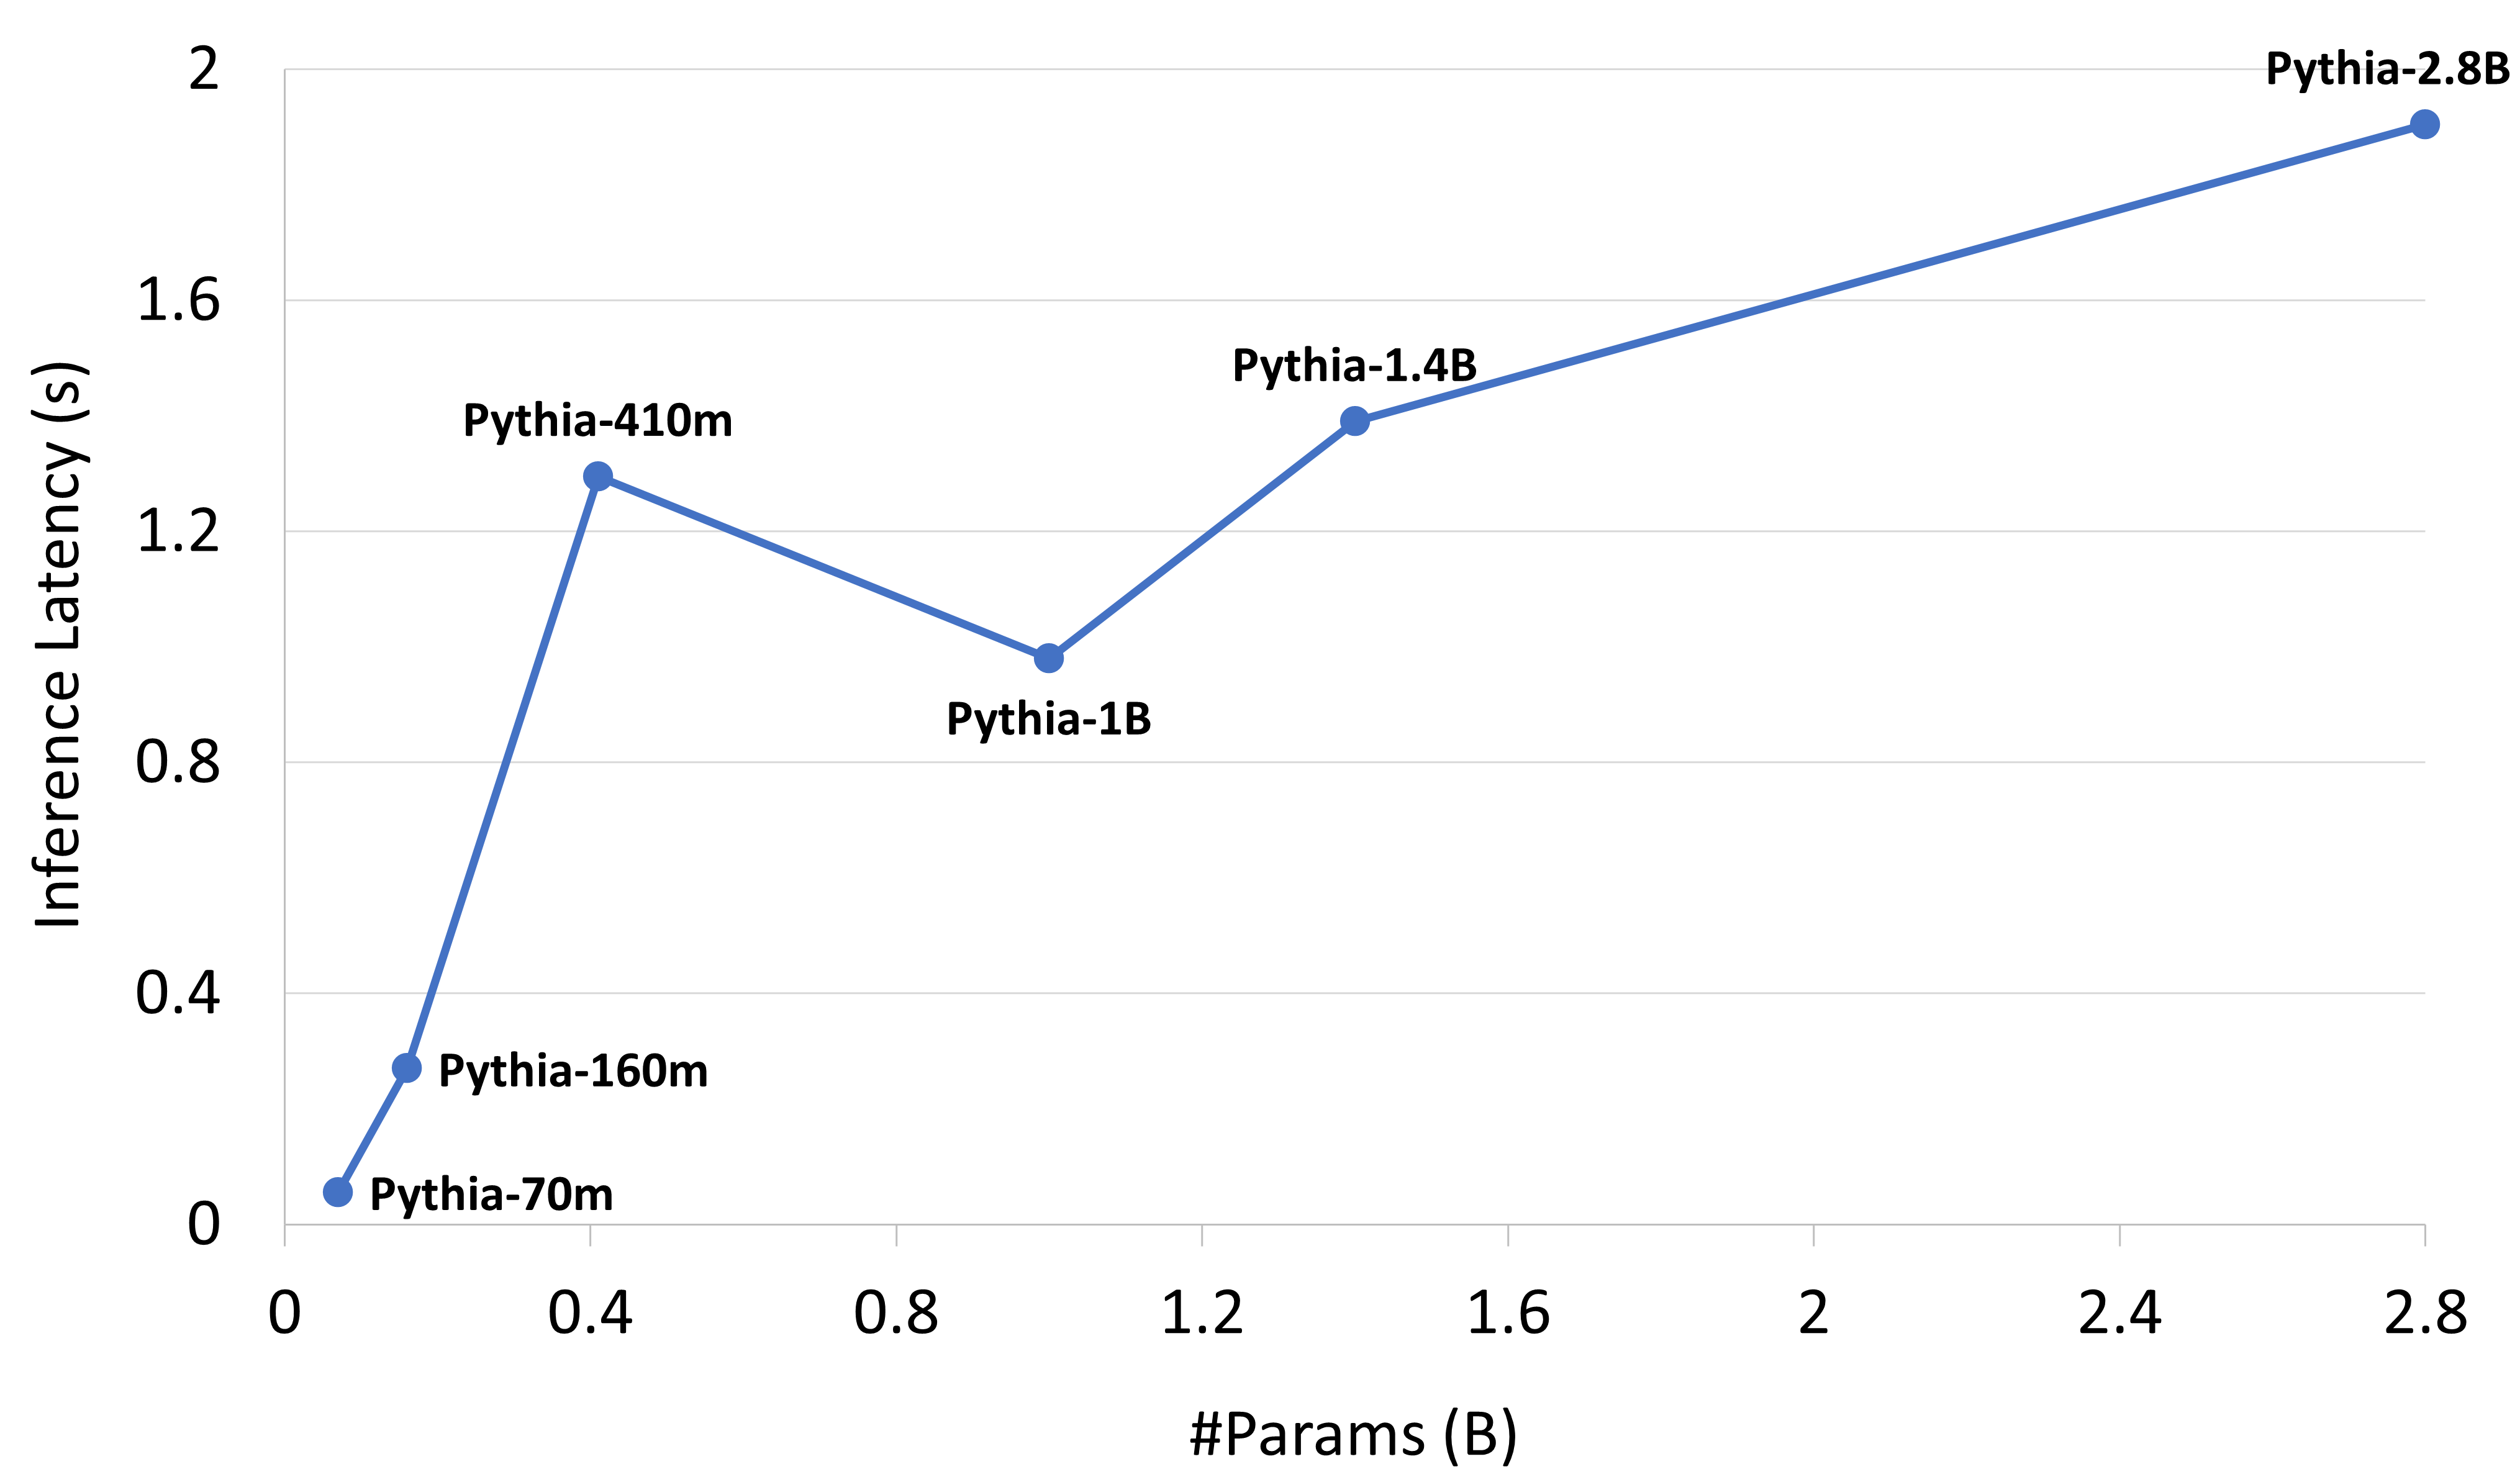
The chart contains six data series, each representing a different model with varying parameter counts and inference latencies. The legend explicitly maps colors to model names:
| Model Name | Parameter Count (B) | Inference Latency (s) | Color (Legend) |
|------------------|---------------------|------------------------|----------------|
| Pythia-70m | 0.0 | 0.0 | Blue |
| Pythia-160m | 0.16 | 0.3 | Blue |
| Pythia-410m | 0.41 | 1.25 | Blue |
| Pythia-1B | 1.0 | 0.9 | Blue |
| Pythia-1.4B | 1.4 | 1.3 | Blue |
| Pythia-2.8B | 2.8 | 1.9 | Blue |
## 3. Key Trends and Observations
- **Trend 1**: The line starts at the origin (0.0B, 0.0s) for Pythia-70m.
- **Trend 2**: A sharp increase in latency occurs between 0.16B (Pythia-160m) and 0.41B (Pythia-410m), rising from 0.3s to 1.25s.
- **Trend 3**: A slight decrease in latency is observed at 1.0B (Pythia-1B), dropping to 0.9s.
- **Trend 4**: A gradual increase in latency resumes from 1.0B to 2.8B, peaking at 1.9s for Pythia-2.8B.
## 4. Spatial Grounding and Color Verification
- **Legend Position**: Right side of the chart.
- **Color Consistency**: All data points are plotted in blue, matching the legend's color coding. No discrepancies observed.
## 5. Component Isolation
- **Main Chart**: The line graph dominates the image, with no additional headers, footers, or annotations.
- **Data Points**: Each model's parameter count and latency are explicitly labeled on the chart.
## 6. Textual Information
- **Axis Labels**:
- X-axis: `#Params (B)`
- Y-axis: `Inference Latency (s)`
- **Legend Labels**:
- Pythia-70m, Pythia-160m, Pythia-410m, Pythia-1B, Pythia-1.4B, Pythia-2.8B
- **Data Point Labels**:
- Pythia-70m (0.0B, 0.0s)
- Pythia-160m (0.16B, 0.3s)
- Pythia-410m (0.41B, 1.25s)
- Pythia-1B (1.0B, 0.9s)
- Pythia-1.4B (1.4B, 1.3s)
- Pythia-2.8B (2.8B, 1.9s)
## 7. Language and Transcription
- **Primary Language**: English
- **No Additional Languages**: All text is in English.
## 8. Final Notes
- The chart illustrates a non-linear relationship between parameter count and inference latency, with a notable dip at 1.0B parameters.
- The data points are explicitly labeled, ensuring clarity in the relationship between model size and performance.