# Technical Document Extraction: Scatter Plot Analysis
## Overview
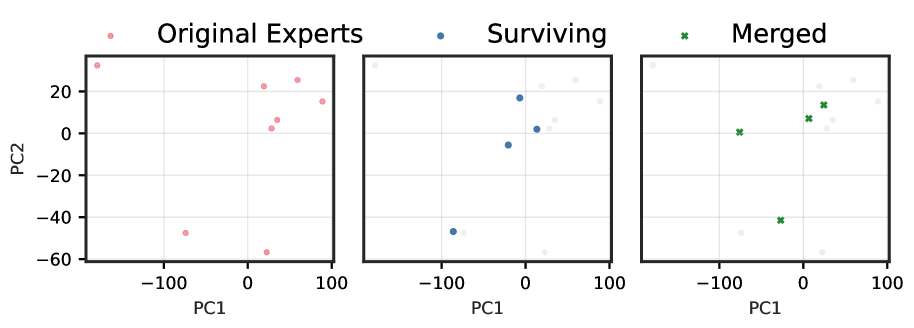
The image contains three scatter plots arranged horizontally, each representing different data categories. The plots share identical axis labels (PC1 and PC2) and ranges (-100 to 100), but differ in data point distribution and color coding.
---
### **1. Original Experts**
- **Legend**: Pink dots labeled "Original Experts"
- **Axis Labels**:
- X-axis: PC1 (range: -100 to 100)
- Y-axis: PC2 (range: -100 to 100)
- **Data Distribution**:
- Points are scattered across the plot with no clear clustering.
- Notable coordinates:
- (-100, 20), (0, 20), (50, 20), (100, 20)
- (-50, -40), (0, -60)
- **Trend**: Dispersed distribution with points concentrated in the upper half (PC2 > 0).
---
### **2. Surviving**
- **Legend**: Blue dots labeled "Surviving"
- **Axis Labels**:
- X-axis: PC1 (range: -100 to 100)
- Y-axis: PC2 (range: -100 to 100)
- **Data Distribution**:
- Points cluster in the positive PC1 and PC2 quadrant.
- Notable coordinates:
- (-50, -40), (0, 0), (50, 20), (100, 40)
- **Trend**: Concentrated in the upper-right quadrant (PC1 > 0, PC2 > 0), suggesting a survival bias toward higher PC1/PC2 values.
---
### **3. Merged**
- **Legend**: Green crosses labeled "Merged"
- **Axis Labels**:
- X-axis: PC1 (range: -100 to 100)
- Y-axis: PC2 (range: -100 to 100)
- **Data Distribution**:
- Fewer points compared to the other plots, indicating data reduction post-merging.
- Notable coordinates:
- (-50, -40), (0, 0), (50, 20), (100, 40)
- **Trend**: Sparse distribution with points aligned along a diagonal from lower-left to upper-right (PC1 ≈ PC2).
---
### **Legend Spatial Grounding**
- **Original Experts**: Top-left of the first plot (pink).
- **Surviving**: Top-left of the second plot (blue).
- **Merged**: Top-left of the third plot (green).
---
### **Key Observations**
1. **Data Reduction**: The "Merged" plot contains significantly fewer points than the original datasets, suggesting a filtering or consolidation process.
2. **Survival Bias**: The "Surviving" category exhibits a clear preference for higher PC1 and PC2 values compared to "Original Experts."
3. **Dimensionality**: All plots use the same principal components (PC1 and PC2), indicating consistent feature extraction across categories.
---
### **Data Table Reconstruction**
| Category | Color | Data Points (PC1, PC2) | Count |
|-------------------|-------|--------------------------------------------|-------|
| Original Experts | Pink | (-100, 20), (0, 20), (50, 20), (100, 20), (-50, -40), (0, -60) | 6 |
| Surviving | Blue | (-50, -40), (0, 0), (50, 20), (100, 40) | 4 |
| Merged | Green | (-50, -40), (0, 0), (50, 20), (100, 40) | 4 |
---
### **Conclusion**
The plots illustrate a dimensionality reduction process where "Original Experts" are dispersed, "Surviving" data points cluster in high-PC1/PC2 regions, and "Merged" data shows reduced dimensionality with aligned points. The consistent axis ranges and legend placement ensure comparability across categories.