Here is a detailed technical description of the image.
### **Overview**
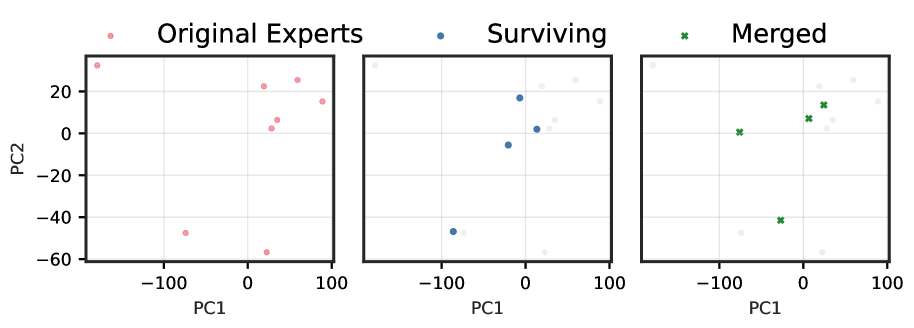
The image presents a series of three scatter plots arranged horizontally, sharing common X and Y axes. The plots illustrate the distribution of data points in a two-dimensional principal component space, labeled "PC1" and "PC2". Each plot shows a different subset or transformation of the data, distinguished by title, marker color, and marker type.
### **Common Chart Elements**
* **Y-axis:** Labeled "**PC2**". The axis has major tick marks and labels at **-60**, **-40**, **-20**, **0**, and **20**.
* **X-axis:** Labeled "**PC1**". The axis has major tick marks and labels at **-100**, **0**, and **100**.
* **Grid:** A light gray grid is overlaid on all three plots, corresponding to the major tick marks of both axes.
---
### **Plot 1: Original Experts**
* **Title:** "**Original Experts**" is displayed at the top center of the plot.
* **Legend:** A red circle marker is shown to the left of the title.
* **Data Points:** The plot contains several red circle markers representing the "Original Experts".
* **Estimated Coordinates (PC1, PC2):**
* (-170, 32)
* (-75, -48)
* (20, 22)
* (28, 2)
* (35, 6)
* (22, -57)
* (60, 25)
* (90, 15)
---
### **Plot 2: Surviving**
* **Title:** "**Surviving**" is displayed at the top center of the plot.
* **Legend:** A blue circle marker is shown to the left of the title.
* **Data Points:** The plot features blue circle markers representing the "Surviving" points. Faint gray circle markers are also visible in the background, corresponding to the positions of the "Original Experts" from the first plot, providing context.
* **Estimated Coordinates of "Surviving" Points (Blue Circles) (PC1, PC2):**
* (-85, -47)
* (-20, -5)
* (-5, 17)
* (15, 2)
---
### **Plot 3: Merged**
* **Title:** "**Merged**" is displayed at the top center of the plot.
* **Legend:** A green 'x' marker is shown to the left of the title.
* **Data Points:** The plot displays green 'x' markers representing the "Merged" points. Similar to the second plot, faint gray circle markers are visible in the background, showing the positions of the "Original Experts".
* **Estimated Coordinates of "Merged" Points (Green 'x's) (PC1, PC2):**
* (-75, 0)
* (-25, -41)
* (8, 7)
* (25, 14)