## Chart: MI Estimation Std
### Overview
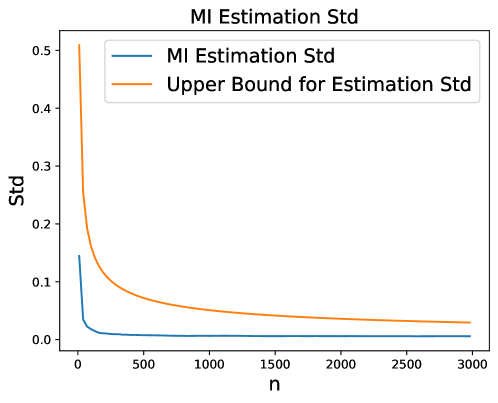
The image is a line chart comparing the standard deviation (Std) of MI (Mutual Information) estimation against an upper bound for the estimation standard deviation, plotted against the variable 'n'. Both lines show a decreasing trend as 'n' increases.
### Components/Axes
* **Title:** MI Estimation Std
* **X-axis:** n (ranging from 0 to 3000 in increments of 500)
* **Y-axis:** Std (ranging from 0.0 to 0.5 in increments of 0.1)
* **Legend:** Located in the top-center of the chart.
* **Blue Line:** MI Estimation Std
* **Orange Line:** Upper Bound for Estimation Std
### Detailed Analysis
* **MI Estimation Std (Blue Line):**
* Trend: Rapidly decreases initially, then plateaus to near zero.
* Approximate values:
* n = 0: Std ≈ 0.14
* n = 100: Std ≈ 0.02
* n = 500: Std ≈ 0.008
* n = 3000: Std ≈ 0.005
* **Upper Bound for Estimation Std (Orange Line):**
* Trend: Decreases rapidly at first, then decreases more gradually, approaching a non-zero value.
* Approximate values:
* n = 0: Std ≈ 0.51
* n = 100: Std ≈ 0.16
* n = 500: Std ≈ 0.08
* n = 3000: Std ≈ 0.03
### Key Observations
* Both the MI Estimation Std and its Upper Bound decrease as 'n' increases.
* The MI Estimation Std decreases much more rapidly and approaches zero, while the Upper Bound decreases more slowly and approaches a non-zero value.
* The difference between the MI Estimation Std and its Upper Bound is significant, especially for smaller values of 'n'.
### Interpretation
The chart suggests that as the variable 'n' increases, the standard deviation of the MI estimation decreases, indicating a more accurate estimation. The upper bound also decreases, but remains significantly higher than the actual MI estimation standard deviation, especially at lower values of 'n'. This implies that the upper bound is a conservative estimate of the standard deviation. The rapid decrease in the MI Estimation Std suggests that the estimation becomes much more stable and reliable as 'n' increases. The non-zero asymptote of the Upper Bound suggests there is a limit to how much the standard deviation can be reduced, even with increasing 'n'.