\n
## Line Chart: MI Estimation Std
### Overview
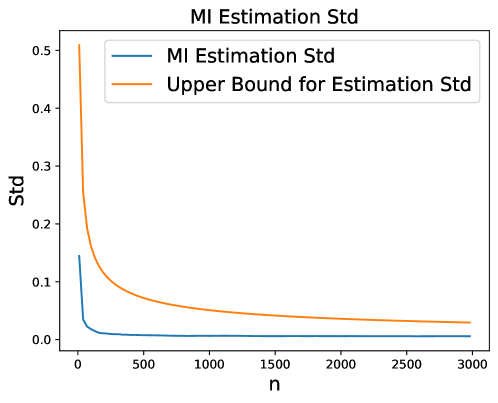
The image presents a line chart illustrating the standard deviation (Std) of Mutual Information (MI) estimation and its upper bound, plotted against the sample size 'n'. The chart aims to demonstrate how the standard deviation decreases as the sample size increases, and how the actual MI estimation standard deviation compares to its theoretical upper bound.
### Components/Axes
* **Title:** "MI Estimation Std" (positioned at the top-center)
* **X-axis:** "n" (sample size), ranging from approximately 0 to 3000.
* **Y-axis:** "Std" (standard deviation), ranging from approximately 0 to 0.55.
* **Legend:** Located in the top-left corner, containing two entries:
* "MI Estimation Std" (represented by a blue line)
* "Upper Bound for Estimation Std" (represented by an orange line)
### Detailed Analysis
* **MI Estimation Std (Blue Line):** The blue line starts at approximately 0.05 at n=0, rapidly decreases, and then plateaus around 0.01 for n > 1000. The trend is a steep initial decline followed by a flattening.
* n = 0: Std ≈ 0.05
* n = 100: Std ≈ 0.02
* n = 200: Std ≈ 0.015
* n = 500: Std ≈ 0.012
* n = 1000: Std ≈ 0.01
* n = 2000: Std ≈ 0.009
* n = 3000: Std ≈ 0.008
* **Upper Bound for Estimation Std (Orange Line):** The orange line starts at approximately 0.5 at n=0, exhibits a rapid decrease, and then gradually levels off around 0.08 for n > 2000. The trend is similar to the blue line, but the values are consistently higher.
* n = 0: Std ≈ 0.5
* n = 100: Std ≈ 0.2
* n = 200: Std ≈ 0.15
* n = 500: Std ≈ 0.1
* n = 1000: Std ≈ 0.08
* n = 2000: Std ≈ 0.07
* n = 3000: Std ≈ 0.06
### Key Observations
* The standard deviation of MI estimation decreases rapidly with increasing sample size 'n' for both the actual estimation and its upper bound.
* The actual MI estimation standard deviation (blue line) is consistently lower than its upper bound (orange line) across all sample sizes.
* The rate of decrease in standard deviation slows down as 'n' increases, suggesting diminishing returns in precision with larger sample sizes.
* The upper bound provides a conservative estimate of the standard deviation, and the actual estimation is always better than this bound.
### Interpretation
The chart demonstrates the relationship between sample size and the precision of Mutual Information estimation. As the sample size increases, the uncertainty in the MI estimation (represented by the standard deviation) decreases. This is expected, as larger samples provide more information and lead to more reliable estimates. The upper bound serves as a theoretical limit on the estimation error. The fact that the actual MI estimation standard deviation remains below the upper bound indicates that the estimation method is performing well. The diminishing returns observed at larger sample sizes suggest that there is a point beyond which increasing the sample size yields only marginal improvements in precision. This information is valuable for determining the appropriate sample size needed to achieve a desired level of accuracy in MI estimation. The chart suggests that for n > 1000, the MI estimation is relatively stable.