## Line Chart: MI Estimation Std
### Overview
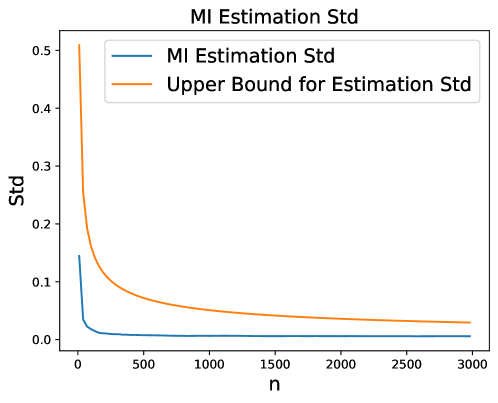
The image displays a line chart titled "MI Estimation Std," which plots the standard deviation (Std) of Mutual Information (MI) estimation against a variable "n" (likely sample size or number of samples). The chart contains two data series: the actual estimated standard deviation and a theoretical upper bound for that standard deviation. Both series show a decreasing trend as "n" increases.
### Components/Axes
* **Chart Title:** "MI Estimation Std" (centered at the top).
* **X-Axis:**
* **Label:** "n"
* **Scale:** Linear scale from 0 to 3000.
* **Major Tick Marks:** 0, 500, 1000, 1500, 2000, 2500, 3000.
* **Y-Axis:**
* **Label:** "Std"
* **Scale:** Linear scale from 0.0 to 0.5.
* **Major Tick Marks:** 0.0, 0.1, 0.2, 0.3, 0.4, 0.5.
* **Legend:** Located in the top-right corner of the plot area.
* **Blue Line:** "MI Estimation Std"
* **Orange Line:** "Upper Bound for Estimation Std"
### Detailed Analysis
**1. Data Series: "MI Estimation Std" (Blue Line)**
* **Trend Verification:** The blue line exhibits a sharp, near-vertical decline from its starting point, followed by a rapid flattening into a very shallow, asymptotic approach towards zero.
* **Approximate Data Points:**
* At n ≈ 0, Std ≈ 0.15.
* At n ≈ 100, Std drops sharply to ≈ 0.02.
* At n ≈ 500, Std is very low, ≈ 0.005.
* From n = 1000 to n = 3000, the line is nearly horizontal, with Std values approaching but remaining slightly above 0.0 (e.g., ≈ 0.001 at n=3000).
**2. Data Series: "Upper Bound for Estimation Std" (Orange Line)**
* **Trend Verification:** The orange line also shows a steep initial decline, but its slope is less severe than the blue line's. It continues to decrease steadily across the entire range of n, maintaining a clear gap above the blue line.
* **Approximate Data Points:**
* At n ≈ 0, Std ≈ 0.50.
* At n ≈ 100, Std ≈ 0.20.
* At n ≈ 500, Std ≈ 0.08.
* At n ≈ 1000, Std ≈ 0.05.
* At n ≈ 2000, Std ≈ 0.035.
* At n ≈ 3000, Std ≈ 0.03.
### Key Observations
* **Relative Position:** The "Upper Bound" (orange) line is consistently positioned above the "MI Estimation Std" (blue) line for all values of n > 0, as expected for an upper bound.
* **Convergence Rate:** The blue line (actual estimation std) converges to near-zero much faster than the orange line (theoretical bound). The most dramatic reduction in standard deviation for both series occurs for n < 500.
* **Asymptotic Behavior:** Both lines appear to approach zero asymptotically as n increases towards infinity, but the blue line does so at a significantly lower value.
### Interpretation
This chart demonstrates the relationship between sample size (`n`) and the precision of Mutual Information (MI) estimation. The key takeaway is that **increasing the sample size dramatically reduces the standard deviation (i.e., increases the precision) of the MI estimate**, particularly for small initial increases in `n`.
* **What the data suggests:** The sharp initial drop indicates that even modest sample sizes yield large gains in estimation stability. The persistent gap between the two lines shows that the theoretical upper bound is conservative; the actual estimation method performs significantly better than this worst-case bound.
* **How elements relate:** The x-axis (`n`) is the independent variable controlling the resource (data). The y-axis (`Std`) is the dependent measure of error/uncertainty. The two lines represent an empirical result versus a theoretical guarantee. Their parallel downward trends confirm the fundamental statistical principle that more data leads to more precise estimates.
* **Notable patterns:** The most critical pattern is the **diminishing returns** after n ≈ 500-1000. While increasing `n` from 0 to 500 reduces the estimation std by over 95%, further increasing it to 3000 yields only marginal absolute improvement. This suggests a practical trade-off point where collecting more data provides minimal benefit for estimation precision. The chart validates the effectiveness of the MI estimation technique, as its actual standard deviation is not only low but also falls well within its proven theoretical limits.