## Line Chart: MI Estimation Standard Deviation vs. Sample Size (n)
### Overview
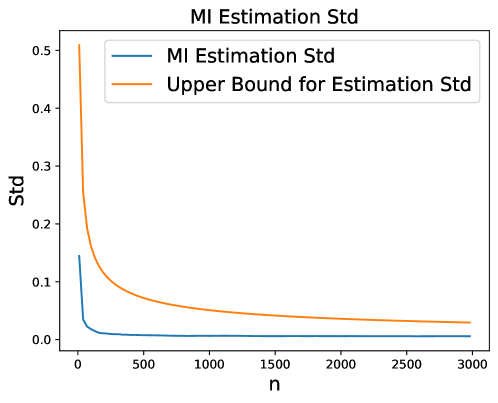
The chart compares two lines representing the standard deviation (Std) of mutual information (MI) estimation across increasing sample sizes (n). The blue line represents the actual MI estimation Std, while the orange line represents the theoretical upper bound for this Std. Both metrics decline as n increases, but the MI estimation Std stabilizes much faster than the upper bound.
### Components/Axes
- **X-axis (n)**: Sample size, ranging from 0 to 3000 in increments of 500.
- **Y-axis (Std)**: Standard deviation of MI estimation, ranging from 0.0 to 0.5 in increments of 0.1.
- **Legend**: Located in the top-right corner, with:
- **Blue line**: "MI Estimation Std"
- **Orange line**: "Upper Bound for Estimation Std"
### Detailed Analysis
1. **MI Estimation Std (Blue Line)**:
- At n=0: Starts at approximately 0.12.
- Sharp decline to near 0.0 by n=500.
- Remains flat at ~0.0 for n > 500.
- Final value at n=3000: ~0.0.
2. **Upper Bound for Estimation Std (Orange Line)**:
- At n=0: Starts at approximately 0.5.
- Gradual decline to ~0.03 by n=3000.
- No stabilization observed within the plotted range.
### Key Observations
- The MI estimation Std drops sharply and stabilizes by n=500, suggesting diminishing returns in precision beyond this point.
- The upper bound declines more slowly, indicating a theoretical limit to how small the Std can become, even with infinite n.
- The blue line is consistently below the orange line, confirming the upper bound acts as a ceiling.
### Interpretation
The data demonstrates that increasing sample size (n) significantly reduces the variability of MI estimation, but only up to a critical threshold (n≈500). Beyond this, further increases in n yield negligible improvements in estimation precision. The persistent gap between the MI estimation Std and its upper bound suggests inherent limitations in the estimation method or data structure, such as noise or model complexity. This implies that optimizing n beyond 500 may not be cost-effective for improving MI estimation reliability.