# Technical Document Extraction: Average JS Divergence Heatmap
## 1. Image Overview
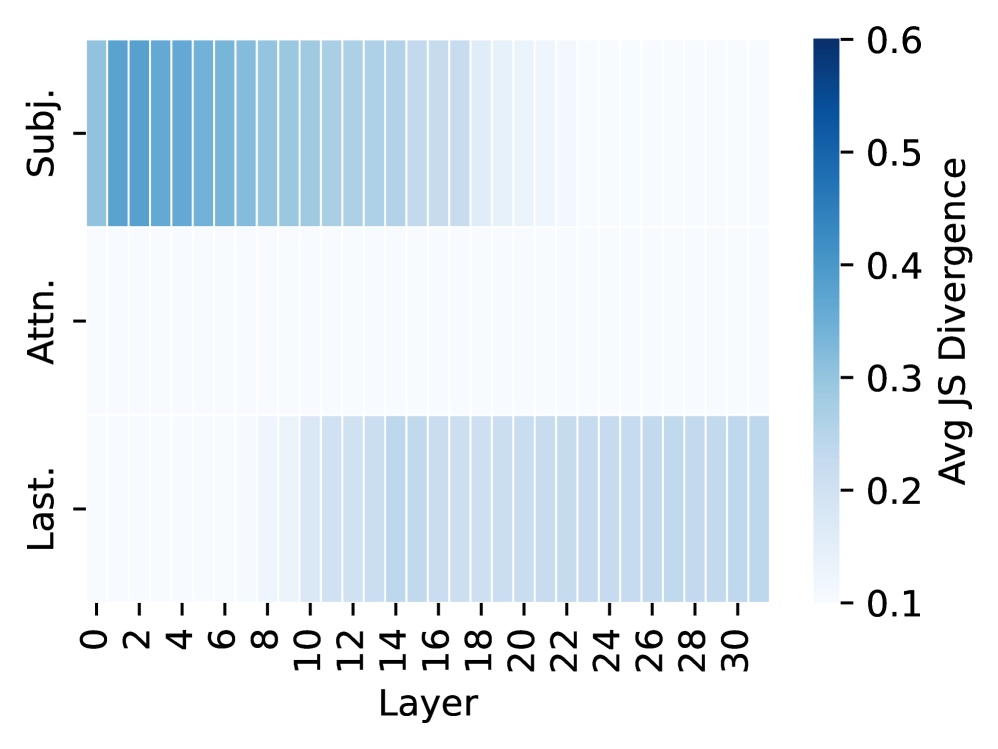
This image is a technical heatmap visualization representing the **Average Jensen-Shannon (JS) Divergence** across different layers of a neural network model (likely a Transformer-based model given the "Layer" and "Attn." labels).
## 2. Component Isolation
### A. Header / Metadata
* **Language:** English.
* **Content:** No explicit title is present within the image frame.
### B. Main Chart (Heatmap)
* **Type:** Heatmap with a grid structure.
* **X-Axis (Horizontal):** Labeled "**Layer**". It contains 32 discrete columns, indexed from **0 to 31**. Numerical markers are provided every two units: `0, 2, 4, 6, 8, 10, 12, 14, 16, 18, 20, 22, 24, 26, 28, 30`.
* **Y-Axis (Vertical):** Contains three categorical labels representing different components or methods:
1. **Subj.** (Top row)
2. **Attn.** (Middle row)
3. **Last.** (Bottom row)
### C. Legend (Color Bar)
* **Spatial Placement:** Located on the far right of the image.
* **Label:** "**Avg JS Divergence**" (oriented vertically).
* **Scale:** Linear gradient from light blue/white to dark blue.
* **Markers:** `0.1, 0.2, 0.3, 0.4, 0.5, 0.6`.
* **Interpretation:** Darker blue indicates a higher JS Divergence (max ~0.6), while lighter/white indicates lower JS Divergence (min ~0.1).
---
## 3. Data Extraction and Trend Analysis
### Series 1: "Subj." (Subject)
* **Visual Trend:** This row starts with moderate-to-high divergence in the early layers, peaking around layers 2-6, and then gradually fades (slopes downward in intensity) as the layer number increases. By layer 20, the values are very low (near white).
* **Estimated Values:**
* **Layers 0-8:** High intensity (~0.35 to 0.45).
* **Layers 10-18:** Moderate-low intensity (~0.2 to 0.25).
* **Layers 20-31:** Very low intensity (~0.1).
### Series 2: "Attn." (Attention)
* **Visual Trend:** This row is consistently very light/white across all 32 layers.
* **Estimated Values:**
* **Layers 0-31:** Constant low divergence (~0.1). There is negligible variation across the depth of the model for this category.
### Series 3: "Last." (Last Token/Layer)
* **Visual Trend:** This row shows the inverse pattern of the "Subj." row. It starts very light (low divergence) in the early layers and gradually increases in intensity (slopes upward) starting around layer 8.
* **Estimated Values:**
* **Layers 0-8:** Very low intensity (~0.1).
* **Layers 10-18:** Light blue, increasing (~0.15 to 0.2).
* **Layers 20-31:** Moderate intensity, stabilizing (~0.25).
---
## 4. Summary Data Table (Reconstructed)
| Layer Range | Subj. (Divergence) | Attn. (Divergence) | Last. (Divergence) |
| :--- | :--- | :--- | :--- |
| **Early (0-8)** | High (~0.4) | Very Low (~0.1) | Very Low (~0.1) |
| **Mid (10-20)** | Decreasing (~0.2) | Very Low (~0.1) | Increasing (~0.2) |
| **Late (22-31)** | Very Low (~0.1) | Very Low (~0.1) | Moderate (~0.25) |
## 5. Technical Conclusion
The visualization indicates a shift in information divergence as data passes through the model layers. The **"Subj."** component is most distinct in the early stages of the model, whereas the **"Last."** component becomes more prominent in the later stages. The **"Attn."** component maintains a consistently low JS Divergence throughout the entire architecture.