\n
## Heatmap: Jensen-Shannon Divergence by Layer and Subject
### Overview
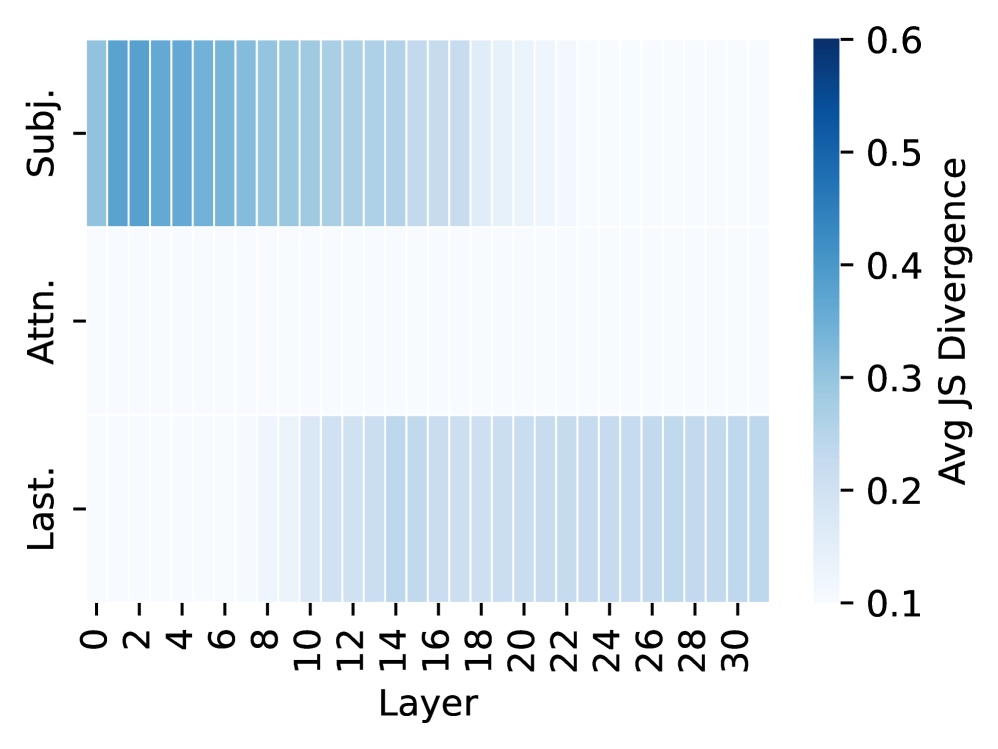
This image presents a heatmap visualizing the average Jensen-Shannon (JS) Divergence across different layers of a model, categorized by subject (Subj.), attention (Attn.), and last layer (Last.). The heatmap displays the divergence values using a color gradient, ranging from dark blue (high divergence) to light blue (low divergence).
### Components/Axes
* **X-axis:** Layer, ranging from 0 to 30, with increments of 2.
* **Y-axis:** Categories: "Subj." (Subject), "Attn." (Attention), and "Last." (Last Layer).
* **Color Scale:** Represents "Avg JS Divergence", ranging from 0.1 (light blue) to 0.6 (dark blue). The color scale is positioned on the right side of the heatmap.
### Detailed Analysis
The heatmap consists of three horizontal rows, each representing one of the categories (Subj., Attn., Last.). Each row contains 16 data points corresponding to the layers 0, 2, 4, 6, 8, 10, 12, 14, 16, 18, 20, 22, 24, 26, 28, and 30.
* **Subject (Subj.):** The divergence values are relatively high (darker blue) for layers 0 to approximately 8, then gradually decrease (lighter blue) towards layer 30.
* Layer 0: Approximately 0.55
* Layer 2: Approximately 0.53
* Layer 4: Approximately 0.52
* Layer 6: Approximately 0.51
* Layer 8: Approximately 0.50
* Layer 10: Approximately 0.48
* Layer 12: Approximately 0.46
* Layer 14: Approximately 0.45
* Layer 16: Approximately 0.44
* Layer 18: Approximately 0.43
* Layer 20: Approximately 0.42
* Layer 22: Approximately 0.41
* Layer 24: Approximately 0.40
* Layer 26: Approximately 0.39
* Layer 28: Approximately 0.38
* Layer 30: Approximately 0.37
* **Attention (Attn.):** The divergence values are consistently lower (lighter blue) than the "Subj." category, remaining around 0.3 to 0.4 throughout all layers.
* Layer 0: Approximately 0.38
* Layer 2: Approximately 0.37
* Layer 4: Approximately 0.36
* Layer 6: Approximately 0.35
* Layer 8: Approximately 0.34
* Layer 10: Approximately 0.33
* Layer 12: Approximately 0.32
* Layer 14: Approximately 0.31
* Layer 16: Approximately 0.30
* Layer 18: Approximately 0.29
* Layer 20: Approximately 0.28
* Layer 22: Approximately 0.27
* Layer 24: Approximately 0.26
* Layer 26: Approximately 0.25
* Layer 28: Approximately 0.24
* Layer 30: Approximately 0.23
* **Last Layer (Last.):** The divergence values are very low (lightest blue) and increase slightly from layer 0 to layer 30.
* Layer 0: Approximately 0.15
* Layer 2: Approximately 0.17
* Layer 4: Approximately 0.19
* Layer 6: Approximately 0.21
* Layer 8: Approximately 0.23
* Layer 10: Approximately 0.25
* Layer 12: Approximately 0.27
* Layer 14: Approximately 0.29
* Layer 16: Approximately 0.30
* Layer 18: Approximately 0.31
* Layer 20: Approximately 0.32
* Layer 22: Approximately 0.33
* Layer 24: Approximately 0.34
* Layer 26: Approximately 0.35
* Layer 28: Approximately 0.36
* Layer 30: Approximately 0.37
### Key Observations
* The "Subj." category exhibits the highest JS Divergence, particularly in the earlier layers.
* The "Attn." category shows consistently lower divergence values compared to "Subj."
* The "Last." category has the lowest divergence values overall, indicating a more stable representation in the final layer.
* All three categories show a general trend of decreasing divergence as the layer number increases, although the rate of decrease varies.
### Interpretation
The heatmap suggests that the "Subject" representation undergoes more significant changes in the earlier layers of the model, as indicated by the higher JS Divergence. This could imply that the initial layers are responsible for capturing and processing subject-specific features. The "Attention" mechanism, on the other hand, appears to be more stable across layers, with consistently lower divergence. The "Last" layer exhibits the lowest divergence, suggesting that the model converges to a more stable representation in the final layer.
The decreasing divergence trend across layers for all categories could indicate that the model learns to refine its representations as it progresses through deeper layers. The differences in divergence values between the categories highlight the varying degrees of change and stability in different aspects of the model's internal representations. The heatmap provides insights into how the model processes information and how different components contribute to the overall representation.