## Heatmap: Average Jensen-Shannon Divergence Across Model Layers and Components
### Overview
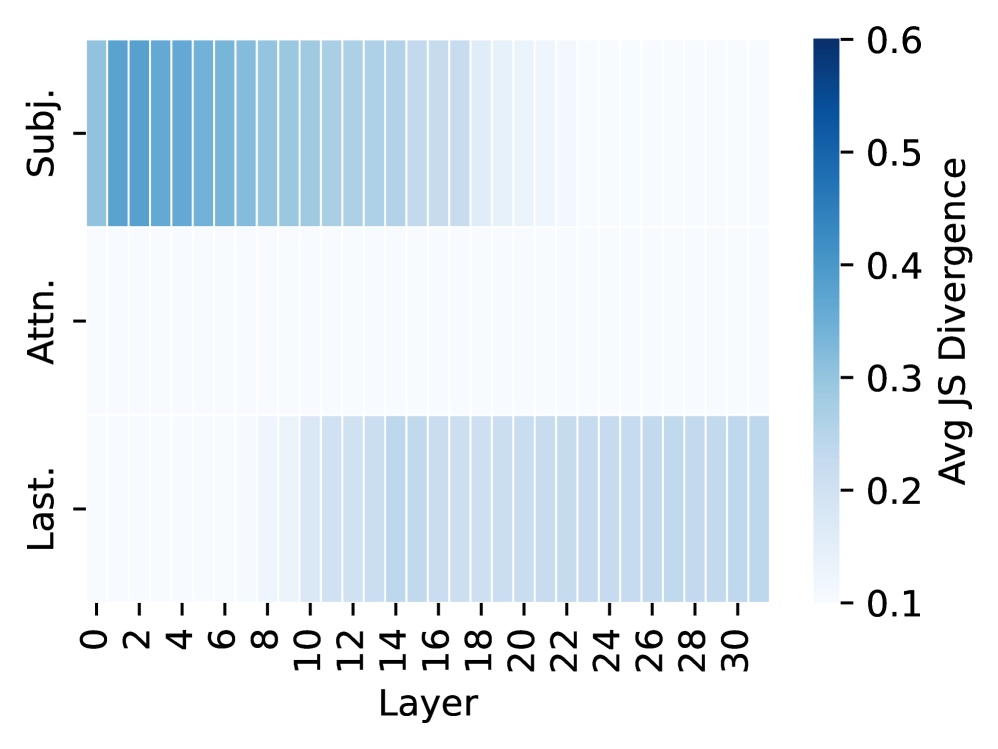
The image is a heatmap chart visualizing the average Jensen-Shannon (JS) divergence across different layers of a model for three distinct components or categories. The divergence is represented by a color gradient, with darker blue indicating higher divergence values.
### Components/Axes
* **X-Axis (Horizontal):** Labeled **"Layer"**. It represents model layers, with tick marks and numerical labels at intervals of 2, starting from **0** and ending at **30** (0, 2, 4, 6, 8, 10, 12, 14, 16, 18, 20, 22, 24, 26, 28, 30).
* **Y-Axis (Vertical):** Contains three categorical labels, positioned on the left side of the chart. From top to bottom, they are:
1. **"Subj."** (likely an abbreviation for "Subject" or a similar term).
2. **"Attn."** (likely an abbreviation for "Attention").
3. **"Last."** (likely an abbreviation for "Last" or "Final").
* **Color Bar/Legend:** Positioned on the right side of the chart. It is a vertical gradient bar labeled **"Avg JS Divergence"**. The scale runs from **0.1** (lightest blue/white at the bottom) to **0.6** (darkest blue at the top), with intermediate markers at **0.2, 0.3, 0.4, and 0.5**.
### Detailed Analysis
The heatmap displays a 3 (rows) x 16 (columns, representing layers 0-30 in steps of 2) grid of colored cells. The color intensity of each cell corresponds to the average JS divergence value for that specific component at that specific layer.
* **Row 1: "Subj."**
* **Trend:** Shows a clear **downward slope** from left to right. Divergence is highest in the earliest layers and decreases steadily as the layer number increases.
* **Values:** The cells for layers 0-4 are the darkest blue in the entire chart, indicating values near or at the maximum of the scale (~0.6). The blue intensity fades progressively. By layers 14-16, the color is a medium blue (~0.3-0.4). From layer 18 onward, the cells become very light blue to nearly white, indicating values approaching the minimum (~0.1-0.2).
* **Row 2: "Attn."**
* **Trend:** The row is **uniformly flat and light**. There is no significant visual trend across layers.
* **Values:** All cells in this row are a very light blue or off-white color, consistent with the low end of the divergence scale. The values appear to be consistently low, likely in the range of **0.1 to 0.15**, across all layers from 0 to 30.
* **Row 3: "Last."**
* **Trend:** Shows a clear **upward slope** from left to right, which is the inverse of the "Subj." trend. Divergence is lowest in the earliest layers and increases as the layer number increases.
* **Values:** The cells for layers 0-8 are very light, similar to the "Attn." row (~0.1-0.15). A noticeable increase in blue intensity begins around layer 10. The color deepens through the middle layers (12-20), reaching a medium blue (~0.3-0.4). The divergence appears to plateau or increase slightly more slowly in the final layers (22-30), maintaining a medium blue shade.
### Key Observations
1. **Inverse Relationship:** The "Subj." and "Last." components exhibit nearly opposite divergence patterns across the model's depth. "Subj." divergence is high early and decays, while "Last." divergence is low early and grows.
2. **Stable Low Divergence for Attention:** The "Attn." component maintains a consistently low average JS divergence throughout all measured layers, suggesting its output distribution is relatively stable or similar across the conditions being compared.
3. **Peak Divergence Location:** The highest divergence values in the entire model are found in the "Subj." component within the first few layers (0-4).
4. **Transition Zones:** The most significant changes in divergence for "Subj." and "Last." occur in the early-to-middle layers (approximately layers 0-16 for "Subj." decay and layers 8-20 for "Last." growth).
### Interpretation
This heatmap likely visualizes how the similarity (or dissimilarity, measured by JS divergence) of internal model representations changes across its depth for different functional components. The data suggests a fundamental shift in processing:
* The **"Subj."** component's representations diverge significantly early in the network, possibly indicating initial, high-variance processing of subject-related features that becomes more refined and consistent in deeper layers.
* The **"Attn."** (Attention) mechanism's representations remain consistently similar across the compared conditions at all depths, implying its role is stable and not a primary source of representational divergence in this analysis.
* The **"Last."** component's representations become increasingly divergent in deeper layers. This could indicate that final-layer outputs or late-stage processing are where the model's representations differentiate the most based on the input or condition being tested, potentially aligning with task-specific decision boundaries.
The contrasting patterns between "Subj." and "Last." highlight a potential architectural or functional dichotomy: early-layer specialization versus late-layer differentiation. The stability of "Attn." provides a control baseline, showing that not all components exhibit such dramatic depth-dependent changes in representational similarity.