## Histogram: Comparison of Continuous CoT vs Default Compute Histogram Distribution of Steps to Convergence
### Overview
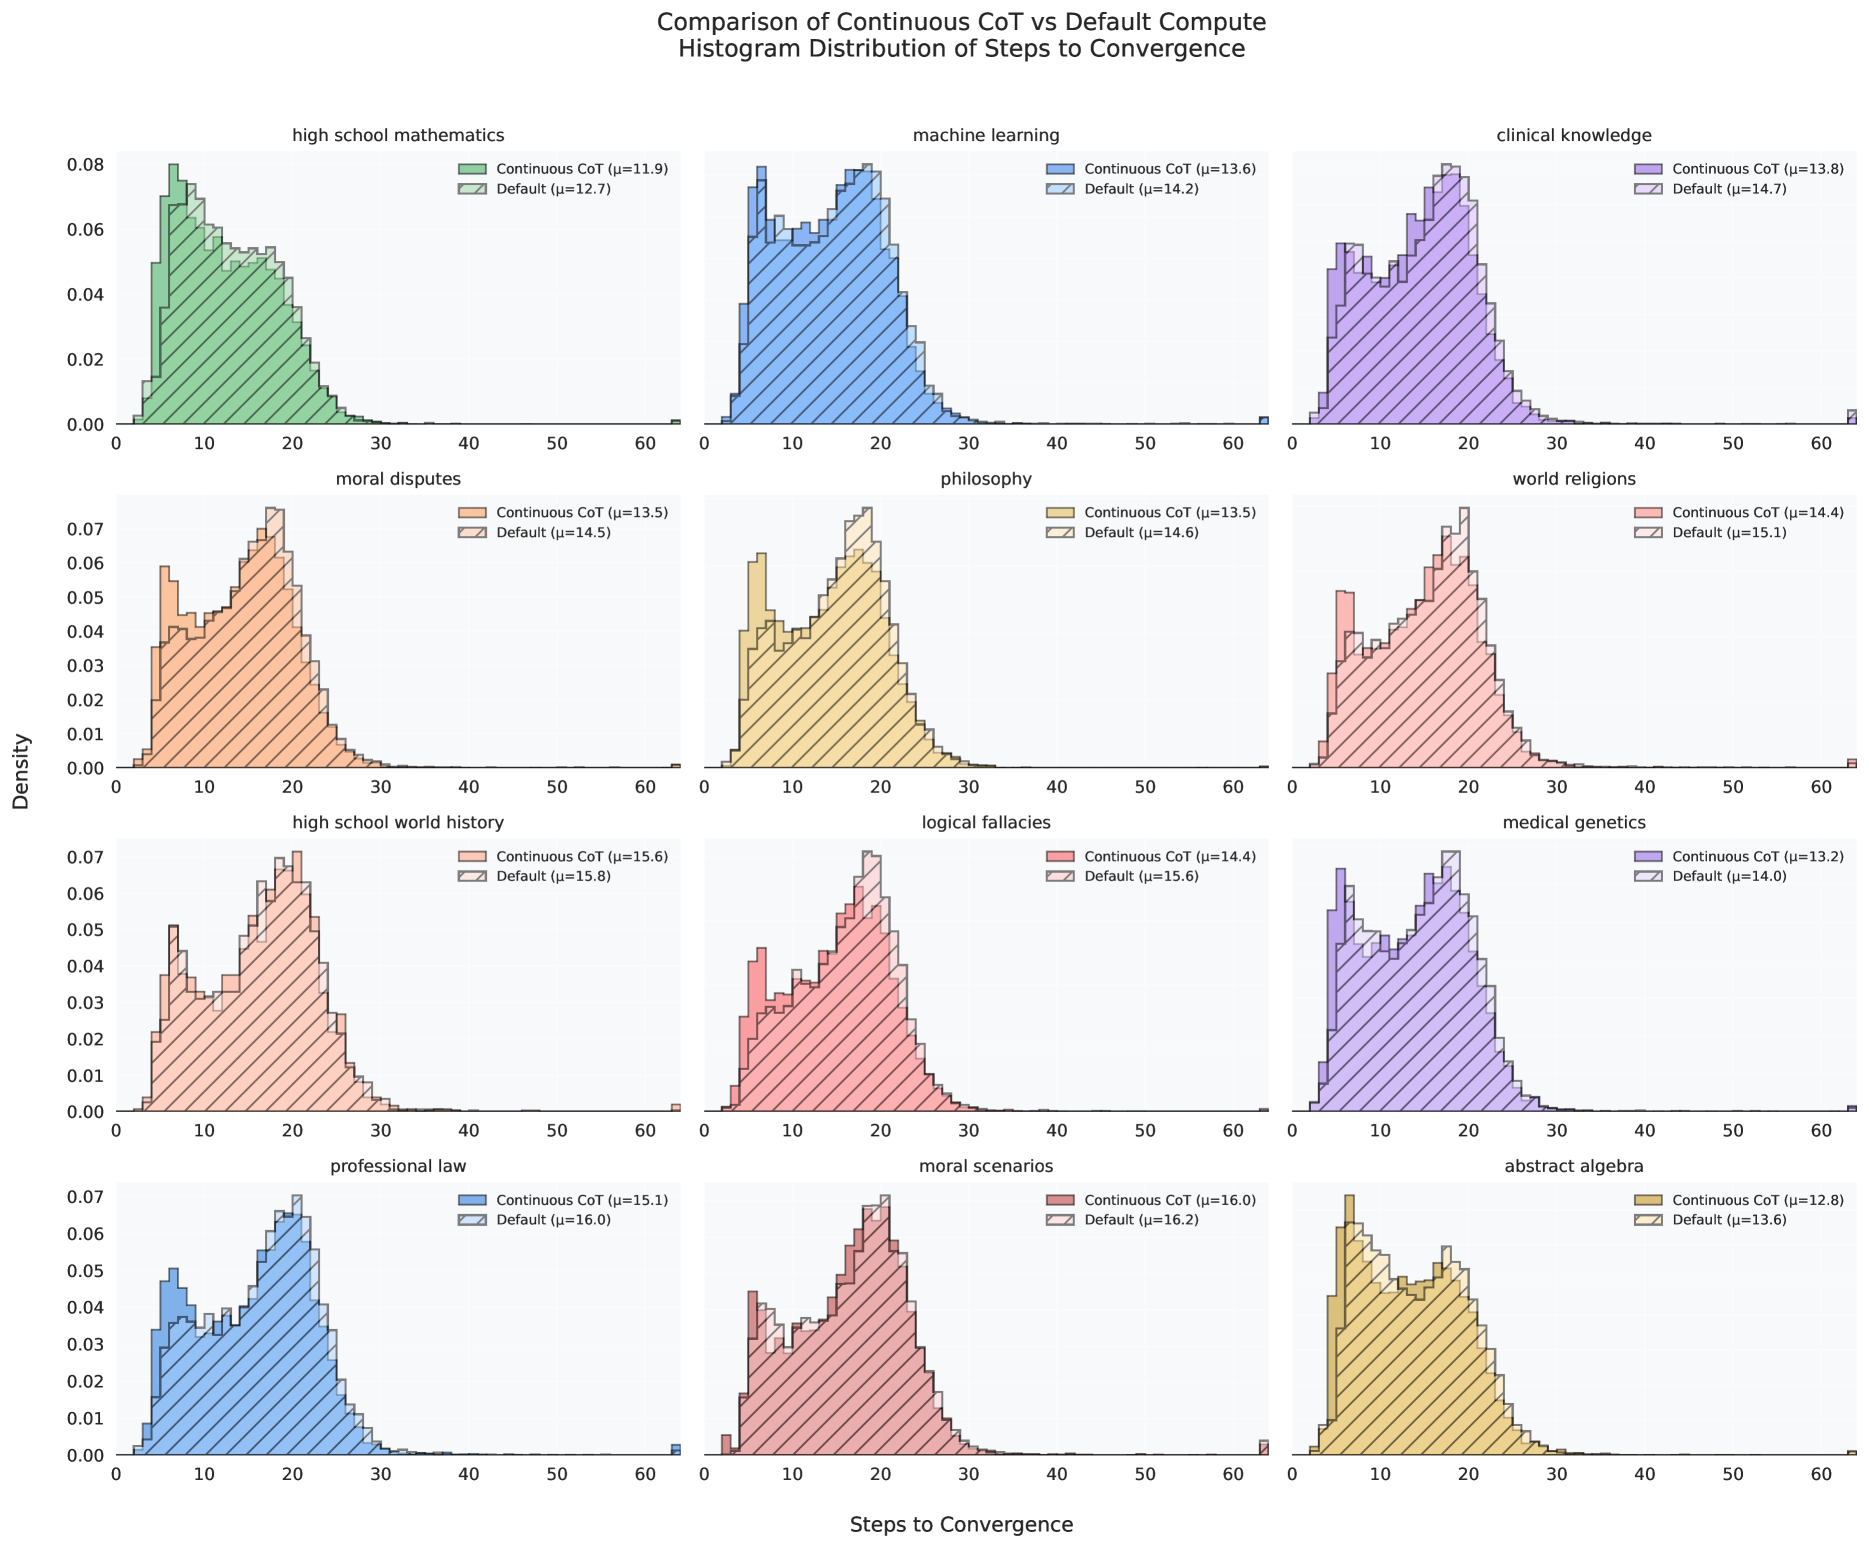
The image presents a series of histograms comparing the distribution of steps to convergence for two methods: "Continuous CoT" and "Default". The histograms are arranged in a 3x4 grid, each representing a different subject or scenario. The x-axis represents the "Steps to Convergence," and the y-axis represents the "Density." Each histogram displays two distributions, one for Continuous CoT and one for Default, with their respective mean (μ) values indicated in the legend.
### Components/Axes
* **Title:** Comparison of Continuous CoT vs Default Compute Histogram Distribution of Steps to Convergence
* **X-axis:** Steps to Convergence (Scale: 0 to 60)
* **Y-axis:** Density (Scale: 0.00 to varying maximum values, approximately 0.06-0.08)
* **Legends:** Located at the top-right of each subplot.
* Continuous CoT (μ=value): Represented by a solid color with diagonal lines. Colors vary by subplot (green, blue, purple, peach, yellow, red, etc.)
* Default (μ=value): Represented by a transparent color with a black outline.
* **Subplot Titles:** Each subplot has a title indicating the subject or scenario (e.g., "high school mathematics," "machine learning," "clinical knowledge," etc.).
### Detailed Analysis
The histograms are organized into a 3x4 grid. Each subplot compares the "Continuous CoT" and "Default" methods for a specific topic.
**Row 1:**
* **high school mathematics:**
* Continuous CoT (Green): μ=11.9. The distribution peaks around 5-10 steps and then decreases.
* Default (Transparent with Black Outline): μ=12.7. The distribution is similar to Continuous CoT but slightly shifted to the right.
* **machine learning:**
* Continuous CoT (Blue): μ=13.6. The distribution peaks around 10-15 steps and then decreases.
* Default (Transparent with Black Outline): μ=14.2. The distribution is similar to Continuous CoT but slightly shifted to the right.
* **clinical knowledge:**
* Continuous CoT (Purple): μ=13.8. The distribution peaks around 10-15 steps and then decreases.
* Default (Transparent with Black Outline): μ=14.7. The distribution is similar to Continuous CoT but slightly shifted to the right.
**Row 2:**
* **moral disputes:**
* Continuous CoT (Peach): μ=13.5. The distribution peaks around 10-15 steps and then decreases.
* Default (Transparent with Black Outline): μ=14.5. The distribution is similar to Continuous CoT but slightly shifted to the right.
* **philosophy:**
* Continuous CoT (Yellow): μ=13.5. The distribution peaks around 10-15 steps and then decreases.
* Default (Transparent with Black Outline): μ=14.6. The distribution is similar to Continuous CoT but slightly shifted to the right.
* **world religions:**
* Continuous CoT (Red): μ=14.4. The distribution peaks around 10-15 steps and then decreases.
* Default (Transparent with Black Outline): μ=15.1. The distribution is similar to Continuous CoT but slightly shifted to the right.
**Row 3:**
* **high school world history:**
* Continuous CoT (Light Red): μ=15.6. The distribution peaks around 10-15 steps and then decreases.
* Default (Transparent with Black Outline): μ=15.8. The distribution is similar to Continuous CoT but slightly shifted to the right.
* **logical fallacies:**
* Continuous CoT (Pink): μ=14.4. The distribution peaks around 10-15 steps and then decreases.
* Default (Transparent with Black Outline): μ=15.6. The distribution is similar to Continuous CoT but slightly shifted to the right.
* **medical genetics:**
* Continuous CoT (Light Purple): μ=13.2. The distribution peaks around 10-15 steps and then decreases.
* Default (Transparent with Black Outline): μ=14.0. The distribution is similar to Continuous CoT but slightly shifted to the right.
**Row 4:**
* **professional law:**
* Continuous CoT (Light Blue): μ=15.1. The distribution peaks around 10-15 steps and then decreases.
* Default (Transparent with Black Outline): μ=16.0. The distribution is similar to Continuous CoT but slightly shifted to the right.
* **moral scenarios:**
* Continuous CoT (Rose): μ=16.0. The distribution peaks around 10-15 steps and then decreases.
* Default (Transparent with Black Outline): μ=16.2. The distribution is similar to Continuous CoT but slightly shifted to the right.
* **abstract algebra:**
* Continuous CoT (Pale Yellow): μ=12.8. The distribution peaks around 10-15 steps and then decreases.
* Default (Transparent with Black Outline): μ=13.6. The distribution is similar to Continuous CoT but slightly shifted to the right.
### Key Observations
* The "Default" method consistently has a higher mean (μ) value than the "Continuous CoT" method across all subjects/scenarios.
* The distributions for both methods are generally right-skewed, indicating that most convergences occur within a relatively small number of steps, but some require significantly more steps.
* The shapes of the distributions are similar for both methods within each subject/scenario, suggesting that the underlying convergence process is similar, but the "Continuous CoT" method tends to converge slightly faster.
### Interpretation
The data suggests that the "Continuous CoT" method generally leads to faster convergence compared to the "Default" method, as indicated by the lower mean number of steps to convergence across various subjects/scenarios. The consistent right-skewness of the distributions implies that while most cases converge quickly, there are instances where both methods require a significantly larger number of steps. The similarity in distribution shapes between the two methods within each subject suggests that "Continuous CoT" optimizes the convergence process without fundamentally altering its nature. The consistent difference in means suggests a systematic advantage of "Continuous CoT" over the "Default" method.