## Histogram Grid: Comparison of Continuous CoT vs Default Compute Distributions
### Overview
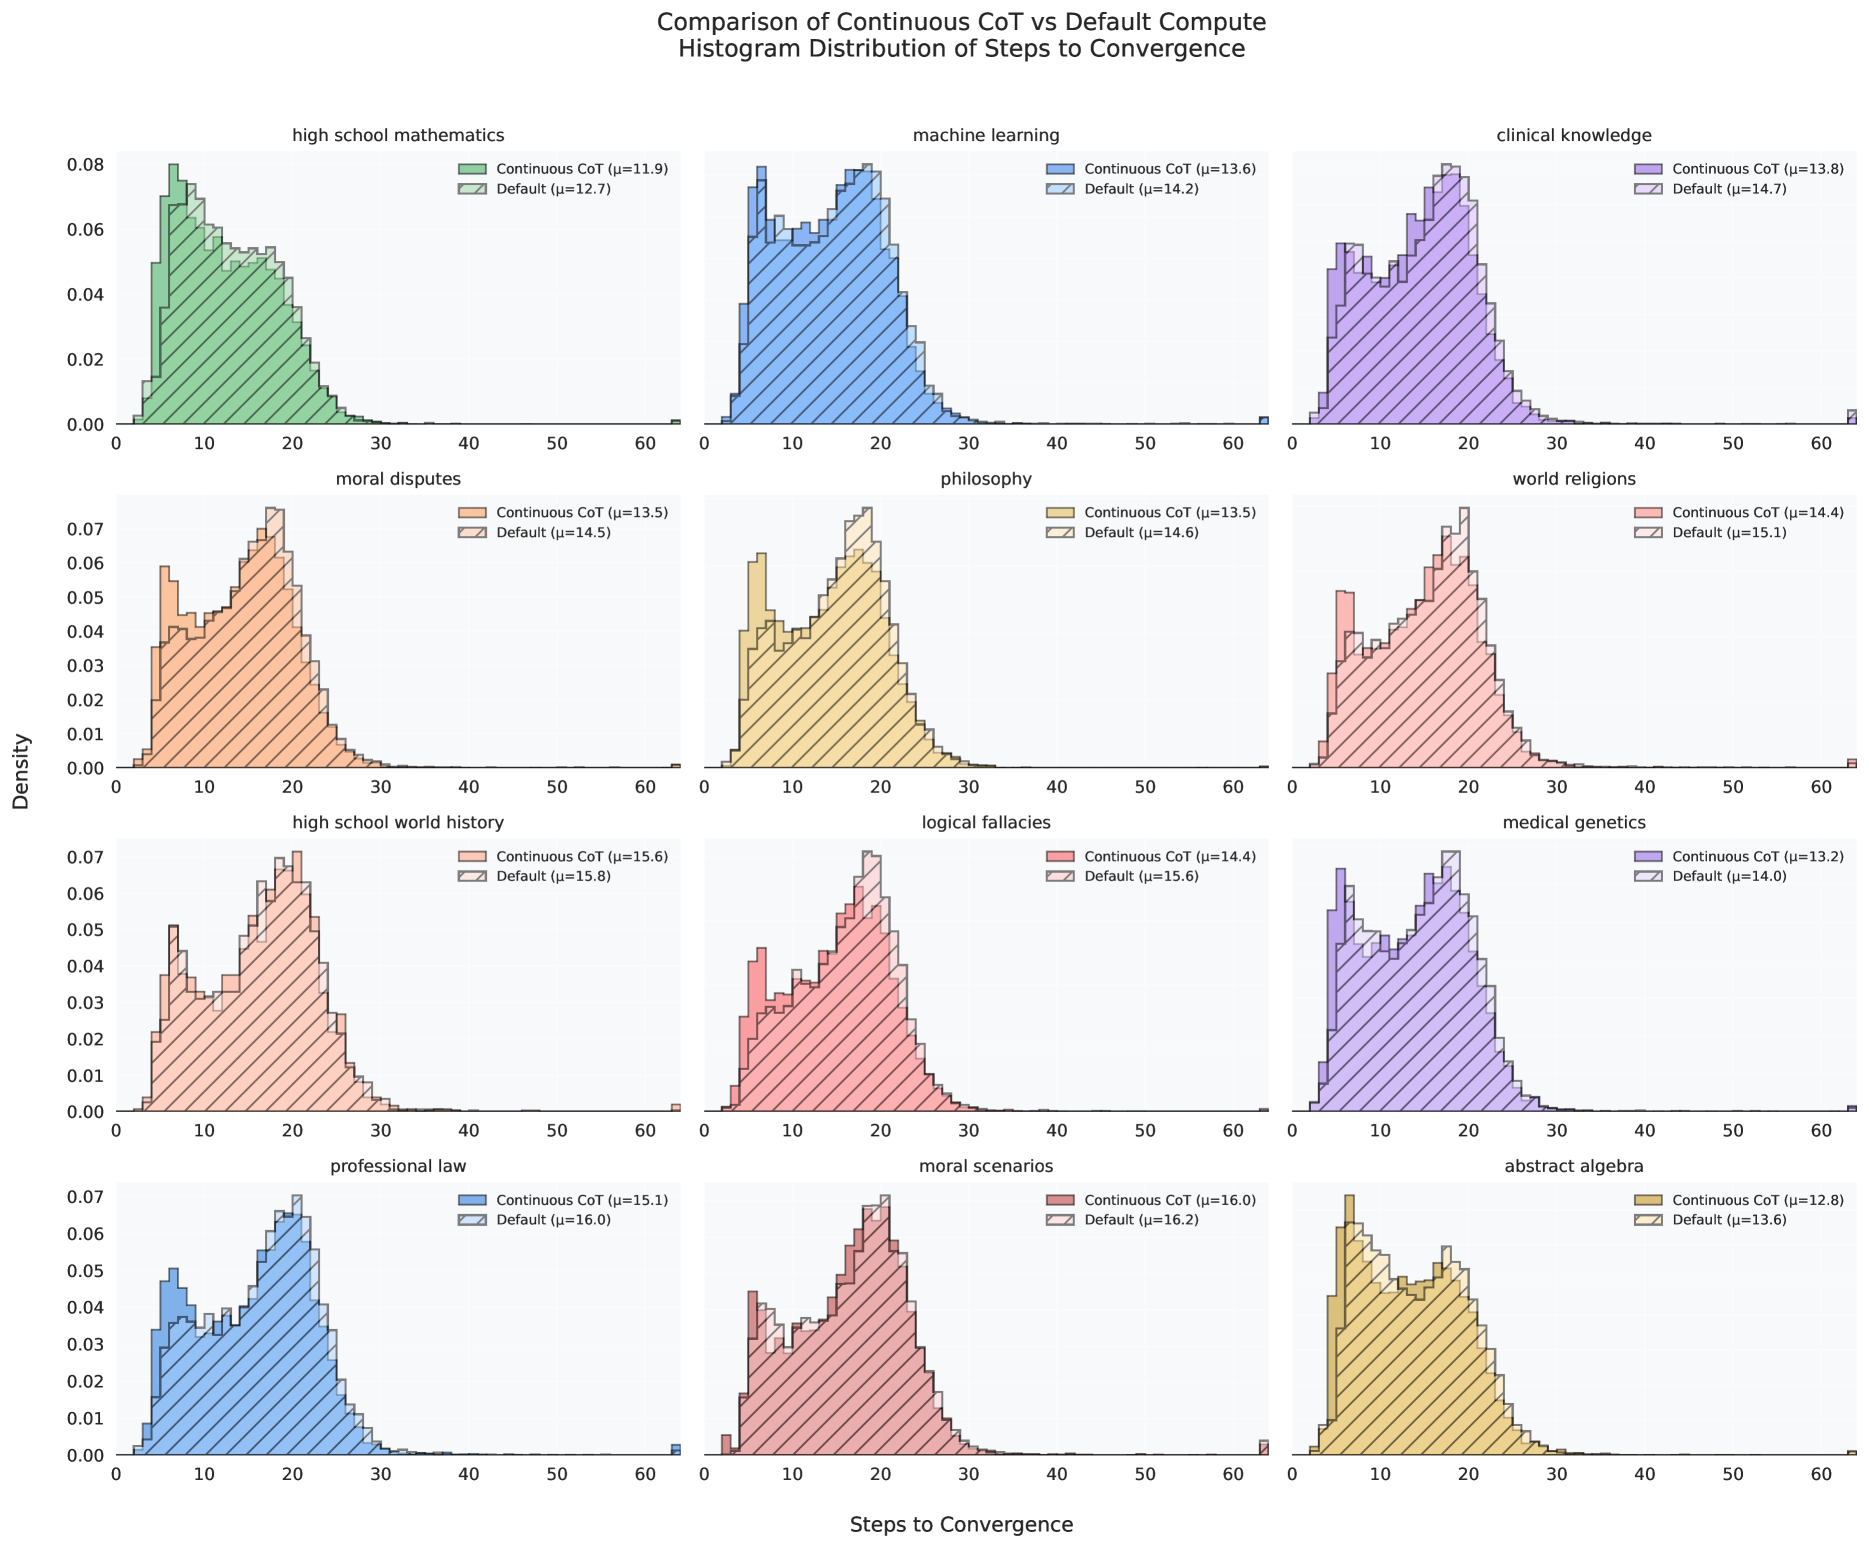
The image displays a 3x4 grid of histograms comparing the distribution of "Steps to Convergence" for two methods: **Continuous CoT** and **Default Compute**. Each subplot represents a distinct domain (e.g., "high school mathematics," "machine learning," "clinical knowledge"). The histograms use diagonal hatching to differentiate the two methods, with numerical means labeled for each distribution.
### Components/Axes
- **X-axis**: "Steps to Convergence" (ranges from 0 to 60 in all subplots).
- **Y-axis**: "Density" (ranges from 0.00 to 0.08, with varying granularity).
- **Legends**: Positioned in the top-right corner of each subplot, explicitly labeling:
- **Continuous CoT** (hatching pattern: diagonal lines, color-coded by domain).
- **Default Compute** (hatching pattern: diagonal lines, color-coded by domain).
- **Domain Labels**: Each subplot title specifies the domain (e.g., "high school mathematics," "machine learning").
### Detailed Analysis
#### Domain-Specific Means (Approximate Values)
1. **High School Mathematics**
- Continuous CoT: μ = 11.9
- Default: μ = 12.7
2. **Machine Learning**
- Continuous CoT: μ = 13.6
- Default: μ = 14.2
3. **Clinical Knowledge**
- Continuous CoT: μ = 13.8
- Default: μ = 14.7
4. **Moral Disputes**
- Continuous CoT: μ = 13.5
- Default: μ = 14.5
5. **Philosophy**
- Continuous CoT: μ = 13.5
- Default: μ = 14.6
6. **World Religions**
- Continuous CoT: μ = 14.4
- Default: μ = 15.1
7. **High School World History**
- Continuous CoT: μ = 15.6
- Default: μ = 15.8
8. **Logical Fallacies**
- Continuous CoT: μ = 14.4
- Default: μ = 15.6
9. **Medical Genetics**
- Continuous CoT: μ = 13.2
- Default: μ = 14.0
10. **Professional Law**
- Continuous CoT: μ = 15.1
- Default: μ = 16.0
11. **Moral Scenarios**
- Continuous CoT: μ = 16.0
- Default: μ = 16.2
12. **Abstract Algebra**
- Continuous CoT: μ = 12.8
- Default: μ = 13.6
#### Distribution Trends
- **Continuous CoT**:
- Generally exhibits **lower mean steps to convergence** across all domains.
- Distributions are **right-skewed**, with peaks concentrated near the mean (e.g., "high school mathematics" peaks at ~12 steps).
- Variability (spread) is narrower compared to Default Compute in most cases.
- **Default Compute**:
- Higher mean steps to convergence in all domains.
- Distributions are **broader and more spread out**, indicating greater variability in convergence steps.
- Peaks are slightly shifted to the right compared to Continuous CoT.
### Key Observations
1. **Consistent Performance Gap**: Continuous CoT outperforms Default Compute in **11 out of 12 domains**, with mean steps to convergence consistently lower.
2. **Domain-Specific Variability**:
- **Lowest Mean (Continuous CoT)**: "Abstract Algebra" (12.8 steps).
- **Highest Mean (Default Compute)**: "Moral Scenarios" (16.2 steps).
3. **Similar Distribution Shapes**: Both methods show comparable right-skewed distributions, suggesting similar convergence patterns but differing in speed.
4. **Outliers**:
- "Moral Scenarios" (Default Compute: μ = 16.2) shows the widest spread, indicating significant variability in convergence steps.
- "Abstract Algebra" (Continuous CoT: μ = 12.8) has the narrowest spread, suggesting highly consistent performance.
### Interpretation
The data demonstrates that **Continuous CoT methods reduce the average steps to convergence** across diverse domains, with the most pronounced benefits in complex or abstract tasks (e.g., "abstract algebra," "professional law"). The narrower distributions for Continuous CoT suggest more predictable and efficient convergence, while Default Compute exhibits greater variability, potentially due to less optimized reasoning pathways.
The consistency of results across domains implies that Continuous CoT’s incremental computation approach (e.g., iterative refinement) may inherently improve efficiency in problem-solving tasks. However, the minimal differences in some domains (e.g., "moral scenarios") highlight potential limitations in highly ambiguous or context-dependent problems.
**Note**: All values are approximate, derived from visual inspection of histogram peaks and legend annotations.