## Line Chart: Run Family (Loops) Accuracy vs. Training Steps
### Overview
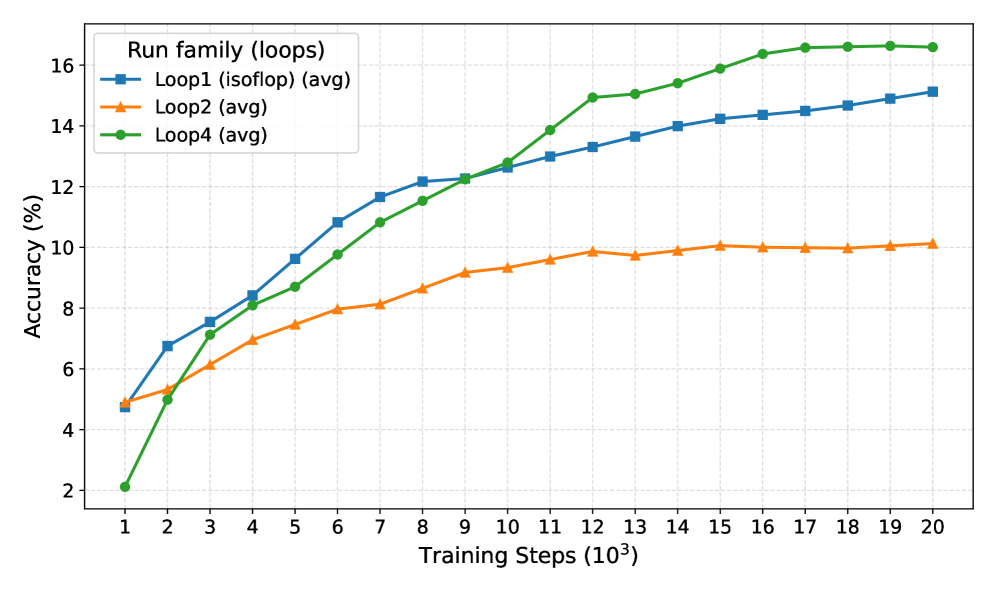
The image is a line chart comparing the accuracy of three different loop configurations (Loop1, Loop2, and Loop4) during training. The x-axis represents training steps (in thousands), and the y-axis represents accuracy (in percentage). The chart shows how the accuracy of each loop changes as the number of training steps increases.
### Components/Axes
* **Title:** Run family (loops)
* **X-axis:** Training Steps (10^3)
* Scale: 1 to 20, incrementing by 1
* **Y-axis:** Accuracy (%)
* Scale: 2 to 16, incrementing by 2
* **Legend:** Located in the top-left corner.
* Loop1 (isoflop) (avg): Blue line with square markers
* Loop2 (avg): Orange line with triangle markers
* Loop4 (avg): Green line with circle markers
### Detailed Analysis
* **Loop1 (isoflop) (avg):** (Blue line, square markers)
* Trend: Generally increasing, with a decreasing rate of increase as training steps increase.
* Data Points:
* Step 1: ~4.8%
* Step 5: ~11%
* Step 10: ~13%
* Step 15: ~14.5%
* Step 20: ~15.2%
* **Loop2 (avg):** (Orange line, triangle markers)
* Trend: Increases initially, then plateaus around 10% after approximately 12,000 training steps.
* Data Points:
* Step 1: ~5%
* Step 5: ~8%
* Step 10: ~9.5%
* Step 15: ~9.9%
* Step 20: ~10%
* **Loop4 (avg):** (Green line, circle markers)
* Trend: Increases rapidly initially, then the rate of increase slows down, eventually plateauing around 16.5% after approximately 16,000 training steps.
* Data Points:
* Step 1: ~2.2%
* Step 5: ~9.5%
* Step 10: ~13%
* Step 15: ~16%
* Step 20: ~16.8%
### Key Observations
* Loop4 (green) achieves the highest accuracy overall, plateauing at approximately 16.8%.
* Loop1 (blue) shows a steady increase in accuracy, but does not reach the same level as Loop4.
* Loop2 (orange) plateaus early, achieving the lowest final accuracy of the three.
* All three loops show diminishing returns in accuracy as the number of training steps increases.
### Interpretation
The chart demonstrates the impact of different loop configurations on the accuracy of a model during training. Loop4 appears to be the most effective configuration, achieving the highest accuracy with a relatively small number of training steps. Loop2, on the other hand, seems to be the least effective, plateauing at a significantly lower accuracy. Loop1 provides a middle ground, showing a steady improvement but not reaching the same performance level as Loop4. The data suggests that the choice of loop configuration can significantly impact the performance of the model, and careful consideration should be given to selecting the optimal configuration for a given task. The plateauing effect observed in all three loops suggests that there may be a limit to the accuracy that can be achieved with these configurations, and further improvements may require different approaches.