# Technical Data Extraction: Mixture-of-Depths (MoD) Performance Analysis
This document contains a detailed extraction of data from a multi-panel technical visualization comparing "Baseline" transformer models against "Mixture-of-Depths" (MoD) variants across parameters, FLOPs, and training time.
---
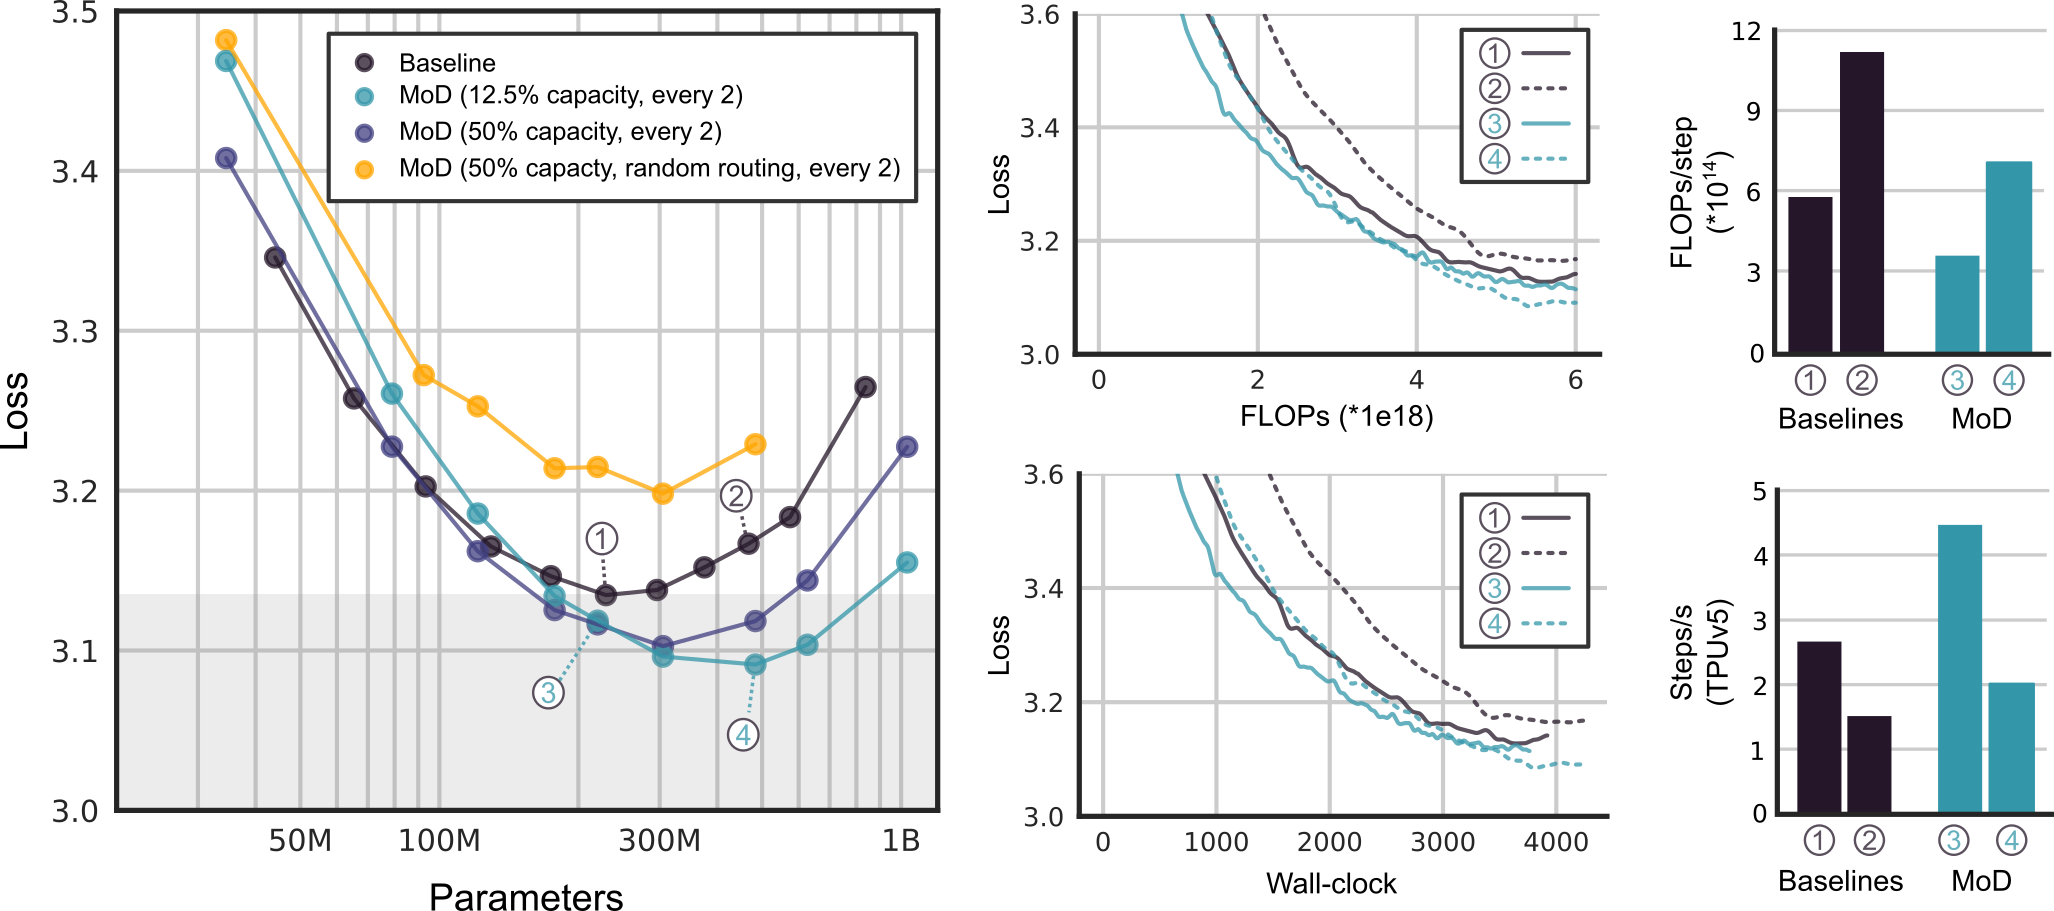
## 1. Main Chart: Loss vs. Parameters (Left Panel)
**Axis Labels:**
* **Y-Axis:** Loss (Linear scale: 3.0 to 3.5)
* **X-Axis:** Parameters (Logarithmic scale: 50M, 100M, 300M, 1B)
**Legend (Top Center):**
* **Dark Purple Circle:** Baseline
* **Teal Circle:** MoD (12.5% capacity, every 2)
* **Indigo Circle:** MoD (50% capacity, every 2)
* **Yellow Circle:** MoD (50% capacity, random routing, every 2)
**Data Series Trends and Key Points:**
* **Baseline (Dark Purple):** Slopes downward to a minimum loss of ~3.14 at ~250M parameters, then curves upward toward 1B parameters.
* **MoD 12.5% (Teal):** Slopes downward more aggressively than the baseline. It achieves a lower minimum loss (~3.10) at ~300M-400M parameters.
* **MoD 50% (Indigo):** Follows a similar trajectory to the 12.5% MoD but stays slightly higher in loss across the parameter range.
* **MoD 50% Random (Yellow):** Consistently the worst performer. Slopes downward but remains significantly higher in loss (min ~3.20) compared to learned routing.
**Specific Callouts (Numbered Markers):**
* **① Baseline:** Pointed to the baseline curve at ~250M parameters.
* **② Baseline (larger):** Pointed to the baseline curve at ~500M parameters.
* **③ MoD:** Pointed to the Teal curve at ~200M parameters.
* **④ MoD:** Pointed to the Teal curve at ~500M parameters.
---
## 2. Training Efficiency Charts (Center Panels)
These charts use a shared legend for four specific model configurations:
* **① Solid Dark Purple:** Baseline (Small)
* **② Dashed Dark Purple:** Baseline (Large)
* **③ Solid Teal:** MoD (Small)
* **④ Dashed Teal:** MoD (Large)
### Top Center: Loss vs. FLOPs
* **Y-Axis:** Loss (3.0 to 3.6)
* **X-Axis:** FLOPs (*1e18) (0 to 6)
* **Trend:** All models show decreasing loss as FLOPs increase. The MoD models (③, ④) achieve lower loss for the same FLOP budget compared to their respective baselines (①, ②).
### Bottom Center: Loss vs. Wall-clock
* **Y-Axis:** Loss (3.0 to 3.6)
* **X-Axis:** Wall-clock (0 to 4000)
* **Trend:** Similar to the FLOPs chart, MoD variants (③, ④) reach lower loss levels faster in terms of wall-clock time than the baselines.
---
## 3. Hardware & Compute Metrics (Right Panels)
### Top Right: FLOPs per Step
* **Y-Axis:** FLOPs/step (*10^14) (0 to 12)
* **X-Axis Categories:** Baselines (①, ②), MoD (③, ④)
* **Data Points:**
* **① Baseline:** ~5.8 * 10^14
* **② Baseline:** ~11.2 * 10^14
* **③ MoD:** ~3.8 * 10^14
* **④ MoD:** ~7.2 * 10^14
* **Observation:** MoD models require significantly fewer FLOPs per step than their baseline counterparts.
### Bottom Right: Throughput (Steps per Second)
* **Y-Axis:** Steps/s (TPUv5) (0 to 5)
* **X-Axis Categories:** Baselines (①, ②), MoD (③, ④)
* **Data Points:**
* **① Baseline:** ~2.7 steps/s
* **② Baseline:** ~1.5 steps/s
* **③ MoD:** ~4.5 steps/s
* **④ MoD:** ~2.1 steps/s
* **Observation:** MoD models achieve higher throughput (steps per second) on TPUv5 hardware compared to baselines.
---
## Summary Table of Numbered Configurations
| ID | Type | Color/Style | Relative Size | Efficiency Note |
| :--- | :--- | :--- | :--- | :--- |
| **①** | Baseline | Dark Purple (Solid) | Small | Standard compute baseline. |
| **②** | Baseline | Dark Purple (Dashed) | Large | Highest FLOPs/step, lowest throughput. |
| **③** | MoD | Teal (Solid) | Small | Lowest FLOPs/step, highest throughput. |
| **④** | MoD | Teal (Dashed) | Large | Better loss-to-FLOP ratio than Baseline ②. |