# Technical Document Extraction
## Chart 1: Loss vs. Parameters
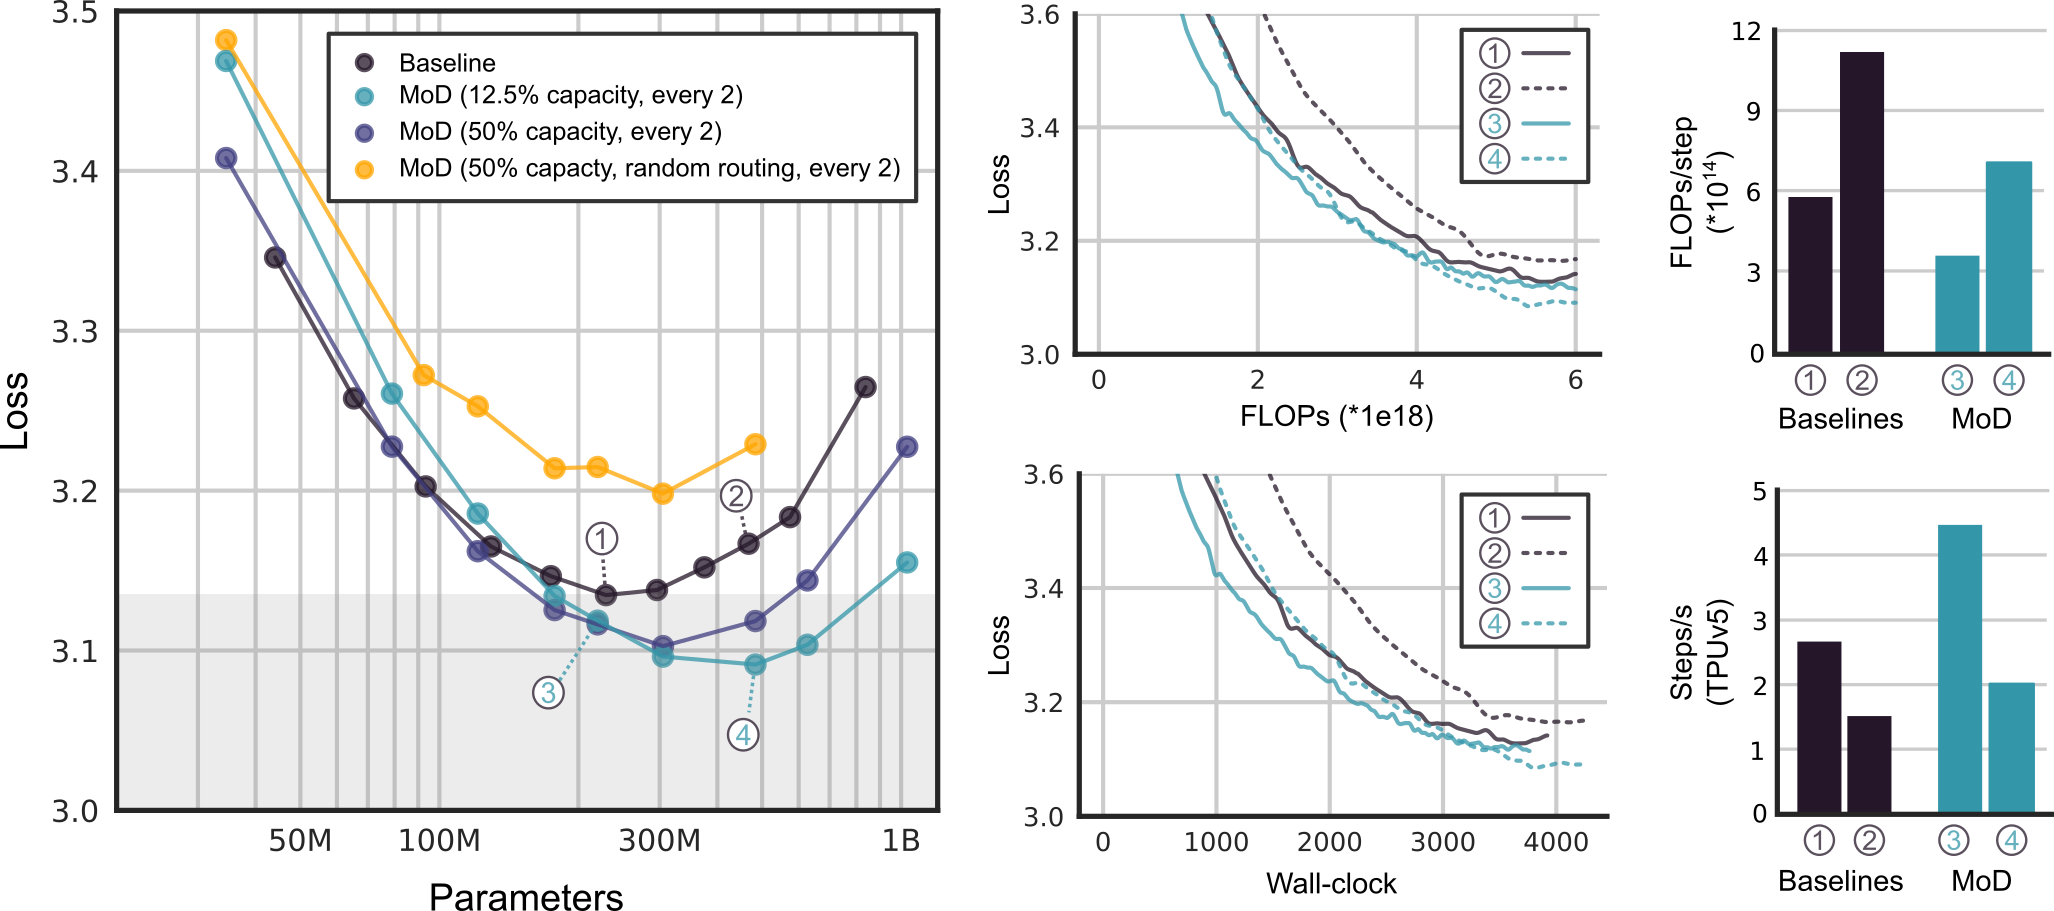
### Axes
- **X-axis**: Parameters (50M to 1B)
- **Y-axis**: Loss (3.0 to 3.5)
### Legend
1. **Baseline** (solid black line)
2. **MoD (12.5% capacity, every 2)** (teal line)
3. **MoD (50% capacity, every 2)** (purple line)
4. **MoD (50% capacity, random routing, every 2)** (orange line)
### Key Trends
- Baseline loss decreases sharply initially, then increases after ~300M parameters.
- MoD (12.5% capacity) shows the steepest initial decline, stabilizing near 3.1 loss.
- MoD (50% capacity, every 2) and MoD (50% capacity, random routing) exhibit similar trends but with slight variations in loss values.
### Annotations
- Points labeled **1–4** correspond to legend entries, marking critical performance thresholds.
---
## Chart 2: Loss vs. FLOPs (Top-Right)
### Axes
- **X-axis**: FLOPs (0 to 4,000 *1e18*)
- **Y-axis**: Loss (3.0 to 3.6)
### Legend
1. **Line 1** (solid black)
2. **Line 2** (dashed black)
3. **Line 3** (solid teal)
4. **Line 4** (dashed teal)
### Key Trends
- All lines show a monotonic decline in loss as FLOPs increase.
- Line 1 (solid black) achieves the lowest loss (~3.1) at 4,000 *1e18* FLOPs.
- Line 4 (dashed teal) has the highest loss (~3.4) across all FLOPs.
---
## Chart 3: FLOPs/step (Bottom-Left)
### Axes
- **X-axis**: Categories (Baselines: 1, 2; MoD: 3, 4)
- **Y-axis**: FLOPs/step (*10¹⁴*)
### Legend
- **Baselines** (dark blue bars)
- **MoD** (teal bars)
### Key Trends
- **Baselines**:
- Category 1: ~6 *10¹⁴* FLOPs/step
- Category 2: ~12 *10¹⁴* FLOPs/step
- **MoD**:
- Category 3: ~3 *10¹⁴* FLOPs/step
- Category 4: ~7 *10¹⁴* FLOPs/step
---
## Chart 4: Steps/TPUv5 (Bottom-Right)
### Axes
- **X-axis**: Categories (Baselines: 1, 2; MoD: 3, 4)
- **Y-axis**: Steps/TPUv5 (0 to 5)
### Legend
- **Baselines** (dark blue bars)
- **MoD** (teal bars)
### Key Trends
- **Baselines**:
- Category 1: ~2.5 Steps/TPUv5
- Category 2: ~1.5 Steps/TPUv5
- **MoD**:
- Category 3: ~4.5 Steps/TPUv5
- Category 4: ~2 Steps/TPUv5
---
## Cross-Referenced Observations
1. **Baseline vs. MoD**:
- MoD configurations (3, 4) outperform Baselines (1, 2) in FLOPs/step and Steps/TPUv5.
- MoD (50% capacity, random routing) achieves the lowest loss in Chart 1 but higher FLOPs/step in Chart 3.
2. **FLOPs vs. Loss**:
- Higher FLOPs correlate with lower loss across all configurations (Chart 2).
3. **Efficiency Trade-offs**:
- MoD (12.5% capacity) balances low loss and high FLOPs/step (Charts 1 and 3).
- MoD (50% capacity, random routing) prioritizes loss reduction at the cost of computational efficiency (Charts 1 and 4).