## 3D Plot: Triangular Surface
### Overview
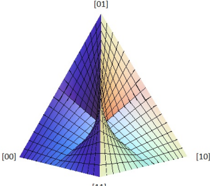
The image is a 3D plot displayed on a triangular base. The surface is colored and appears to be a function mapped onto the triangle. The corners of the triangle are labeled with binary values.
### Components/Axes
* **Corners of Triangle:**
* Bottom-left: \[00]
* Top: \[01]
* Bottom-right: \[10]
* Bottom: \[11]
* **Surface Color:** The surface is colored, with the color varying across the surface. The color ranges from blue to yellow.
### Detailed Analysis
The surface is curved and appears to be a continuous function defined over the triangular domain. The color gradient provides additional information about the function's values. The grid lines on the surface help visualize its shape.
### Key Observations
* The surface has a complex shape with both concave and convex regions.
* The color gradient suggests that the function's values vary smoothly across the domain.
### Interpretation
The plot represents a function defined over a triangular domain. The function's values are visualized using both the surface's height and its color. The plot provides a visual representation of the function's behavior and can be used to identify key features such as maxima, minima, and saddle points. The binary labels at the corners of the triangle may represent specific states or conditions.