## 3D Ternary Diagram with Binary Vertex Labels
### Overview
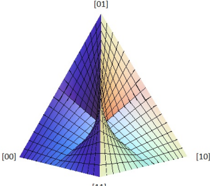
The image displays a three-dimensional surface plot rendered as a triangular (tetrahedral) wireframe mesh. The plot is defined over a triangular domain, with its surface colored according to a continuous value gradient. The visualization appears to represent a function or data distribution over a simplex, commonly used in fields like machine learning (e.g., loss landscapes), chemistry (phase diagrams), or probability theory.
### Components/Axes
* **Shape & Structure:** A 3D triangular pyramid (tetrahedron) projected onto a 2D plane. The surface is represented by a dense, quadrilateral mesh grid.
* **Vertex Labels:** The four vertices of the tetrahedron are labeled with binary codes:
* **Top Vertex:** `[01]`
* **Bottom-Left Vertex:** `[00]`
* **Bottom-Right Vertex:** `[10]`
* **Bottom-Center Vertex (below the main triangle):** `[11]`
* **Color Scale:** A continuous color gradient is applied to the surface mesh. The gradient transitions from **dark blue** on the left side (near vertex `[00]`) through **cyan/green** in the center, to **red/orange** on the right side (near vertex `[10]`). The area near the top vertex `[01]` is a mix of purple and blue.
* **Missing Elements:** There are no explicit axis titles, numerical tick marks, a color bar legend, or a chart title present in the image.
### Detailed Analysis
* **Spatial Grounding & Color Distribution:**
* The **blue region** is concentrated on the left face of the tetrahedron, anchored at vertex `[00]`.
* The **red/orange region** is concentrated on the right face, anchored at vertex `[10]`.
* The **green/cyan region** forms a band or valley running through the center of the visible surface, between the blue and red zones.
* The **purple region** is located on the upper-left face, near vertex `[01]`.
* The mesh lines are uniformly spaced, creating a regular grid over the deformed triangular surface.
* **Trend Verification:** The color gradient suggests a smooth, continuous variation of an underlying scalar value across the domain defined by the four binary-labeled states. The value appears to be lowest (blue) near `[00]`, increases through the center (green), and is highest (red) near `[10]`. The relationship to vertex `[01]` and `[11]` is less clear from the color alone.
### Key Observations
1. **Binary Vertex Coding:** The use of `[00]`, `[01]`, `[10]`, `[11]` strongly suggests the vertices represent the four possible states of a 2-bit system or a 2-dimensional binary variable.
2. **Absence of Quantitative Scale:** Without a color bar or numerical labels, the exact values of the plotted function are unknown. The visualization is qualitative, showing relative differences and gradients.
3. **Projection Artifacts:** The 3D shape is projected onto 2D, causing foreshortening. The vertex `[11]` appears detached below the main triangle, indicating it is the fourth point of the tetrahedron in 3D space.
4. **Smooth Manifold:** The surface appears continuous and differentiable, with no sharp discontinuities or isolated peaks visible from this angle.
### Interpretation
This diagram is likely a visualization of a **function defined over a 2-simplex or a probability space of four discrete states**. The binary labels are key to its meaning.
* **Possible Contexts:**
* **Machine Learning:** It could represent a **loss landscape** or **accuracy surface** for a model with two binary hyperparameters or operating in a 2-bit quantized space. The color would then indicate loss (blue=low, red=high) or accuracy.
* **Quantum Computing/Information:** The vertices `[00]`, `[01]`, `[10]`, `[11]` could represent basis states of a two-qubit system. The surface might visualize the expectation value of an operator or the probability amplitude of a state as a superposition of these basis states varies.
* **Game Theory/Economics:** It could map the payoff or utility for a player given a mixed strategy over four pure strategies labeled by binary codes.
* **Reading Between the Lines:** The gradient from `[00]` (blue) to `[10]` (red) suggests these two states are "opposites" in terms of the measured value. The central green valley might represent an optimal or balanced mixed state. The position of `[01]` in a different color zone (purple) indicates it has a distinct value profile compared to the `[00]`-`[10]` axis. The diagram emphasizes the **topology and relative relationships** between states rather than precise numerical values. It answers the question: "How does the measured quantity change as we move smoothly between these four fundamental binary configurations?"