## 3D Pyramid Diagram: Binary State Representation
### Overview
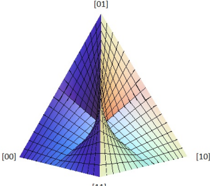
The image depicts a 3D pyramid-like structure with three triangular faces converging at a central apex. The pyramid is divided into a grid pattern with color gradients transitioning from blue (left) to yellow (right). Labels are positioned at the vertices of the pyramid, indicating binary or ternary states.
### Components/Axes
- **Vertices**:
- Apex: `[01]` (top center)
- Base vertices: `[00]` (bottom left), `[10]` (bottom right)
- **Grid Lines**: Black grid lines divide each triangular face into smaller sections, suggesting subdivisions or transitions.
- **Color Gradient**: Blue-to-yellow gradient across the pyramid, possibly indicating a variable (e.g., intensity, probability, or state transition).
- **No legend, axis titles, or numerical scales are present.**
### Detailed Analysis
- **Labels**:
- `[01]` (apex): Likely represents a binary state where the second bit is active.
- `[00]` (bottom left): Binary state with both bits inactive.
- `[10]` (bottom right): Binary state where the first bit is active.
- **Grid Pattern**: The grid lines may represent intermediate states or transitions between the labeled vertices. However, no explicit data points or numerical values are provided.
- **Color Gradient**: The blue-to-yellow gradient could imply a scalar value (e.g., probability, energy, or confidence) increasing from left to right, but this is speculative without a legend.
### Key Observations
1. **Symmetry**: The pyramid is symmetrical, with the apex at the top and two base vertices.
2. **Binary/Ternary States**: The labels `[00]`, `[01]`, and `[10]` suggest a binary or ternary system, possibly representing states in a computational or logical model.
3. **Lack of Explicit Data**: No numerical values, legends, or axis labels are present, limiting quantitative analysis.
### Interpretation
The diagram likely represents a **state transition model** or **binary/ternary system** with three primary states (`[00]`, `[01]`, `[10]`). The apex (`[01]`) may act as a central or transitional state, while the base vertices represent distinct states. The grid lines and color gradient could symbolize intermediate transitions or probabilistic relationships between states. However, the absence of a legend or numerical data prevents definitive interpretation of the color gradient or grid subdivisions.
**Note**: The image does not contain explicit facts, numerical data, or a legend. The analysis is based on structural and symbolic elements.